Copper: Up 0.5% to $5.97 — Below MA50 ($6.24) — Caution
· Commodities · QuoteReporter
Copper: Up 0.5% to $5.97 — Below MA50 ($6.24) — Caution
Analysis Date: June 25, 2026
📊 Current Market Data
CURRENT PRICE
$5.97
DAILY CHANGE
+0.50%
WEEKLY CHANGE
-7.85%
52W HIGH
$6.65
52W LOW
$4.32
💡 Key Market Factors
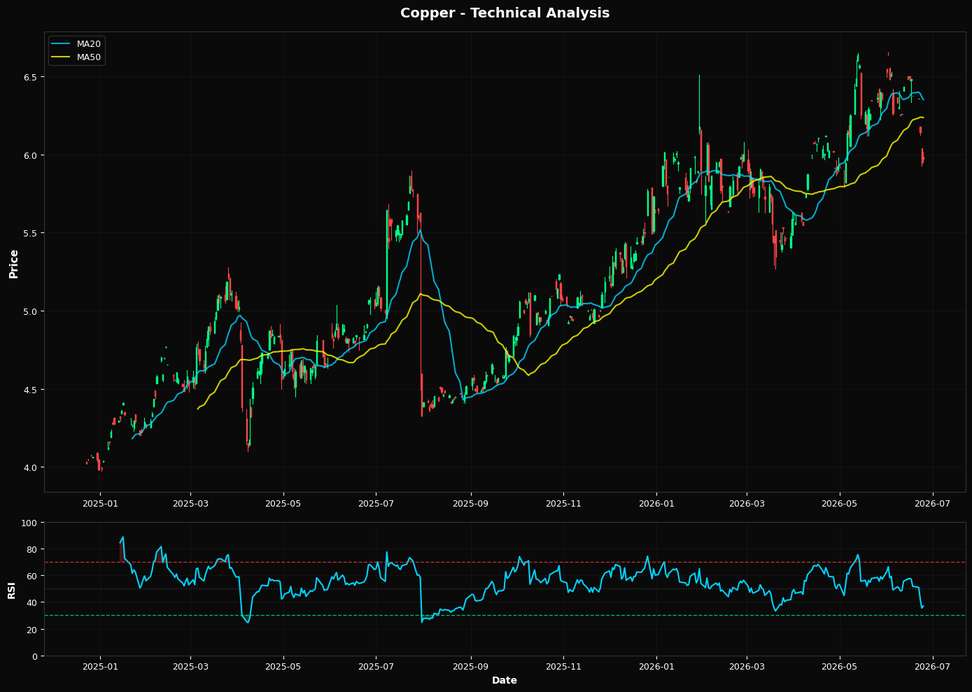
Copper's current price action suggests a potential rebound opportunity, driven by technical support and macroeconomic dynamics. The most pressing macro driver for copper today is the strength of the U.S. dollar, which has been exerting downward pressure on commodity prices. As the Federal Reserve maintains a hawkish stance, the dollar remains strong, making dollar-denominated commodities like copper more expensive for foreign buyers. This dynamic has contributed to copper's recent weekly decline of 7.85%. However, any signs of a dovish pivot by the Fed could weaken the dollar, providing a tailwind for copper prices. From a technical perspective, copper is showing signs of being oversold, with an RSI of 37.0, which is below the neutral 50 level and approaching oversold territory. This suggests a potential for a price rebound. The current price of $5.97 is below both the 20-day moving average of $6.35 and the 50-day moving average of $6.24, indicating a bearish trend. However, it remains above the 200-day moving average of $5.60, which could act as a long-term support level. Additionally, the nearest Fibonacci support at $5.76 provides a critical level to watch. If copper holds above this level, it could signal a reversal and attract buying interest. A key risk that could alter the current outlook for copper is a significant shift in Chinese demand. As the world's largest consumer of copper, any substantial change in China's economic activity or policy could dramatically impact copper prices. For instance, stronger-than-expected industrial output or infrastructure spending in China could boost demand and drive prices higher, counteracting the bearish pressure from the strong dollar. Looking ahead, the upcoming U.S. inflation data release will be crucial. A lower-than-expected inflation figure could prompt the Fed to reconsider its rate hike trajectory, potentially weakening the dollar and providing a boost to copper prices. Conversely, persistently high inflation could reinforce the Fed's hawkish stance, keeping the dollar strong and maintaining pressure on copper. This data point will be pivotal in confirming or invalidating the current technical setup and macroeconomic influences on copper.📈 Technical Indicators Summary
RSI (14)
37.0
50-Day MA
$6.24
200-Day MA
$5.60
Fib Level
38.2%
📊 Technical Analysis Chart (18-Month View)
📐 Fibonacci Retracement Analysis
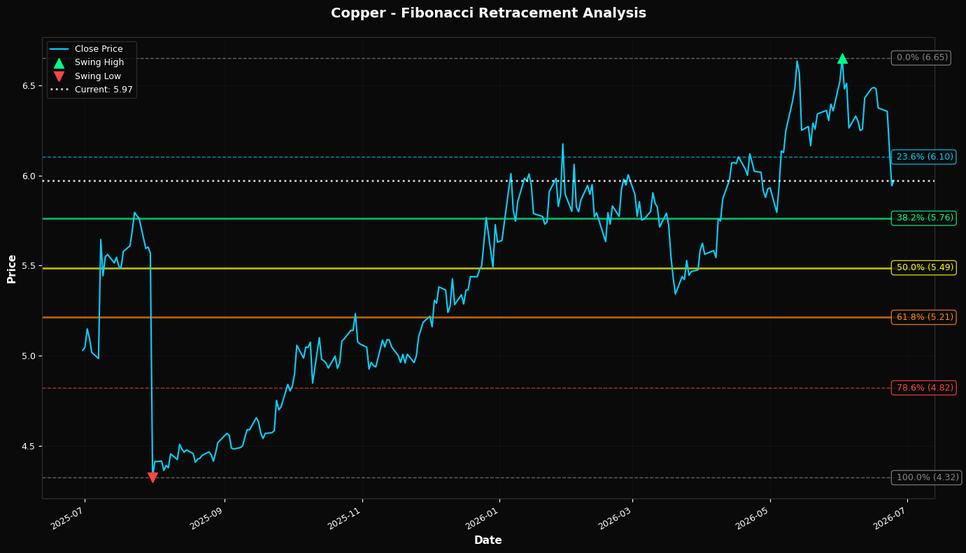
🎯 Key Trading Levels
Key Fibonacci Levels:
- 38.2%: $5.76
- 50.0%: $5.49
- 61.8%: $5.21
Support: $4.32 (Swing Low), $6.24 (50-Day MA)
Resistance: $6.65 (Swing High)
Disclaimer
The content on MarketsFN.com is provided for educational and informational purposes only. It does not constitute financial advice, investment recommendations, or trading guidance. All investments involve risks, and past performance does not guarantee future results. You are solely responsible for your investment decisions and should conduct independent research and consult a qualified financial advisor before acting. MarketsFN.com and its authors are not liable for any losses or damages arising from your use of this information.