Copper: Up 0.5% to $6.36 — Bullish Structure — Above MA50 & MA200
· Commodities · QuoteReporter
Copper: Up 0.5% to $6.36 — Bullish Structure — Above MA50 & MA200
Analysis Date: June 09, 2026
📊 Current Market Data
CURRENT PRICE
$6.36
DAILY CHANGE
+0.54%
WEEKLY CHANGE
-4.30%
52W HIGH
$6.65
52W LOW
$4.32
💡 Key Market Factors
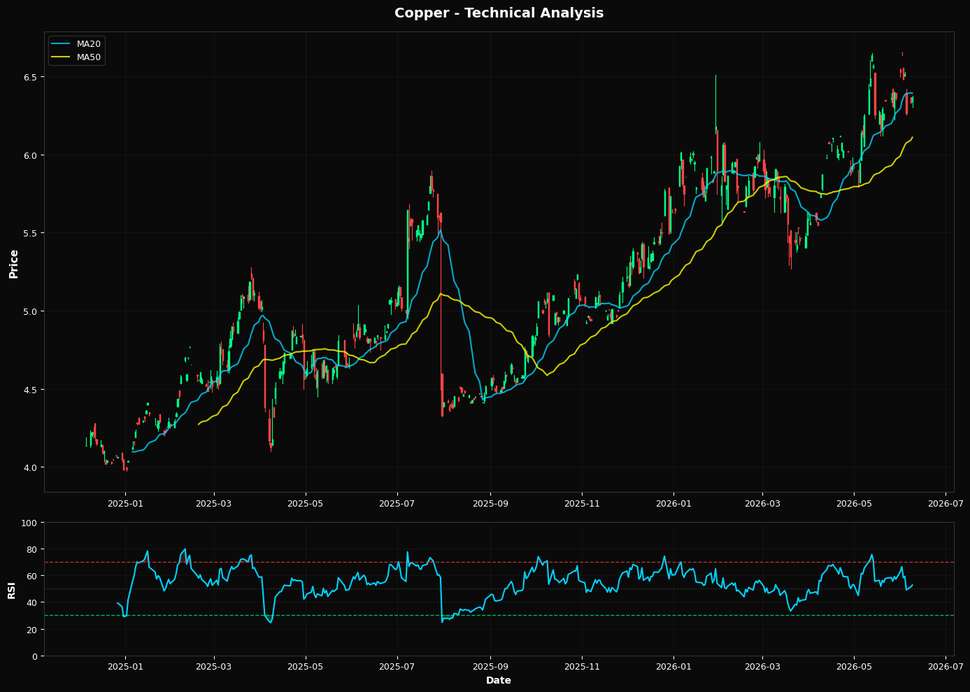
Copper's current price action suggests a potential rebound, but macroeconomic headwinds could limit upside potential. The most pressing macro driver for copper today is the strength of the U.S. dollar. As the Federal Reserve maintains a hawkish stance on interest rates, the dollar remains robust, exerting downward pressure on dollar-denominated commodities like copper. This dynamic is crucial because a strong dollar makes copper more expensive for foreign buyers, potentially dampening demand. While inflation concerns persist, they are secondary to the immediate impact of currency fluctuations on copper pricing. From a technical perspective, copper's Relative Strength Index (RSI) of 52.6 indicates a neutral stance, suggesting neither overbought nor oversold conditions. However, the price is slightly below its 20-day moving average of $6.39, which could act as a short-term resistance. The 50-day moving average at $6.11 provides a more substantial support level, aligning with the broader uptrend indicated by the 200-day moving average at $5.50. The nearest Fibonacci support at $5.76 further reinforces this support zone. Given these technical indicators, there is a mild bullish bias, but the market needs to clear the 20-day moving average to confirm a stronger upward trajectory. A key risk that could alter copper's outlook is any unexpected shift in Federal Reserve policy. Should the Fed signal a pause or reversal in its rate hikes, the dollar could weaken, providing a tailwind for copper prices. Conversely, stronger-than-expected U.S. economic data could reinforce the Fed's hawkish stance, strengthening the dollar further and pressuring copper prices. The market may be underpricing the potential for a dovish pivot, which could lead to a rapid revaluation of copper if such a shift occurs. Looking ahead, the upcoming U.S. employment report could be a pivotal catalyst. A weaker-than-expected jobs number might prompt the Fed to reconsider its rate trajectory, potentially weakening the dollar and boosting copper prices. Conversely, a strong employment report could solidify the Fed's current path, maintaining pressure on copper. This data point will be critical in confirming or invalidating the current technical and macroeconomic outlook for copper.📈 Technical Indicators Summary
RSI (14)
52.6
50-Day MA
$6.11
200-Day MA
$5.50
Fib Level
38.2%
📊 Technical Analysis Chart (18-Month View)
📐 Fibonacci Retracement Analysis
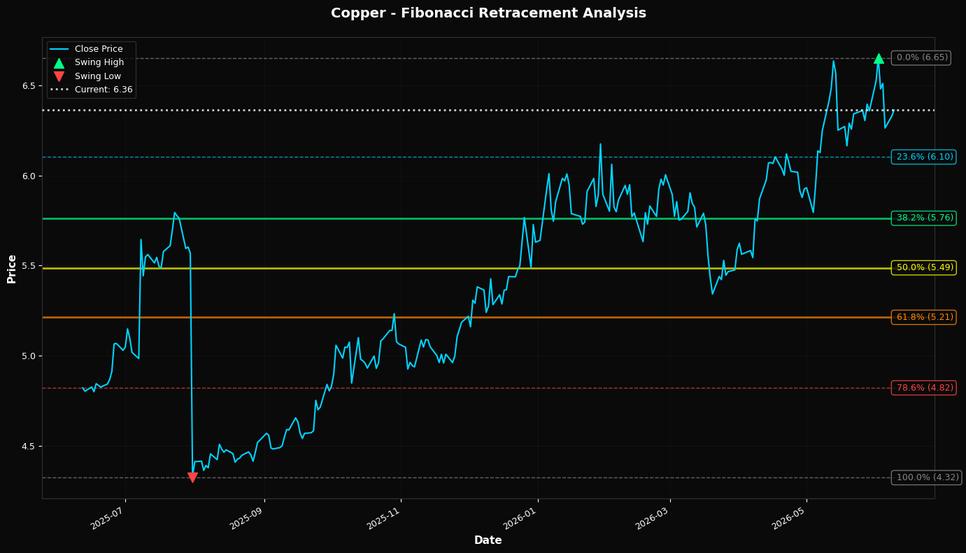
🎯 Key Trading Levels
Key Fibonacci Levels:
- 38.2%: $5.76
- 50.0%: $5.49
- 61.8%: $5.21
Support: $4.32 (Swing Low), $6.11 (50-Day MA)
Resistance: $6.65 (Swing High)
Disclaimer
The content on MarketsFN.com is provided for educational and informational purposes only. It does not constitute financial advice, investment recommendations, or trading guidance. All investments involve risks, and past performance does not guarantee future results. You are solely responsible for your investment decisions and should conduct independent research and consult a qualified financial advisor before acting. MarketsFN.com and its authors are not liable for any losses or damages arising from your use of this information.