Copper: Up 0.8% to $6.32 — Bullish Structure — Above MA50 & MA200
· Commodities · QuoteReporter
Copper: Up 0.8% to $6.32 — Bullish Structure — Above MA50 & MA200
Analysis Date: June 08, 2026
📊 Current Market Data
CURRENT PRICE
$6.32
DAILY CHANGE
+0.84%
WEEKLY CHANGE
-3.19%
52W HIGH
$6.65
52W LOW
$4.32
💡 Key Market Factors
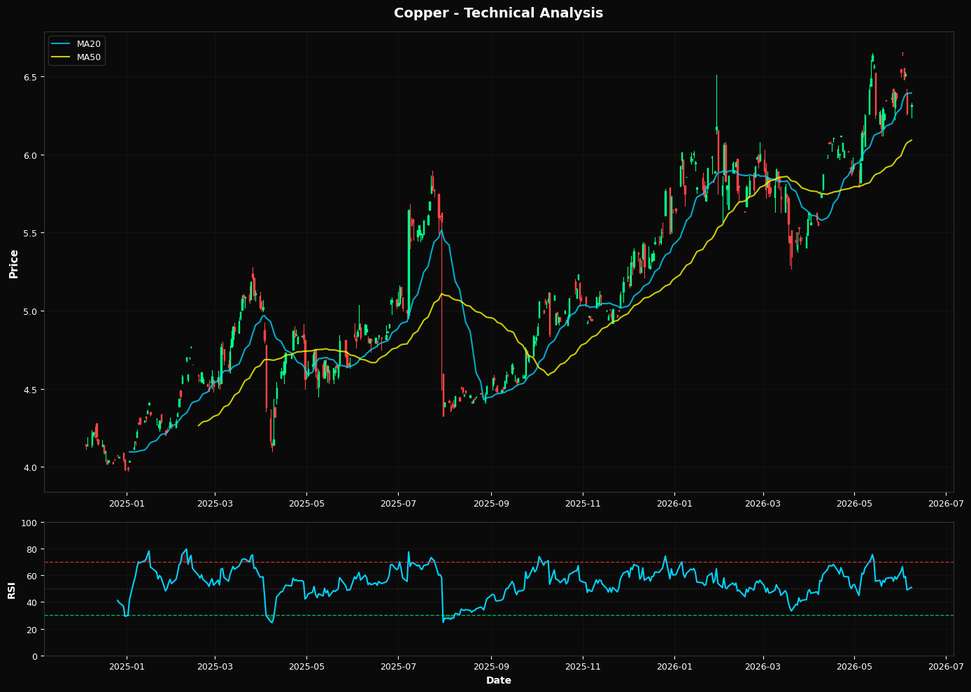
Copper's current price action suggests a potential rebound, but macroeconomic headwinds could limit upside. The most pressing macro driver for copper today is the strength of the U.S. dollar, which has been bolstered by the Federal Reserve's hawkish stance on interest rates. As copper is priced in dollars, a stronger USD makes it more expensive for foreign buyers, potentially dampening demand. This dynamic is crucial given copper's recent weekly decline of -3.19%, indicating that the market may be underestimating the impact of a persistently strong dollar on global demand. From a technical perspective, copper is at a critical juncture. The Relative Strength Index (RSI) at 50.9 suggests a neutral momentum, neither overbought nor oversold. However, the price is currently below the 20-day moving average of $6.39, indicating short-term bearishness, yet it remains above the 50-day moving average of $6.09 and significantly above the 200-day moving average of $5.49. This positioning suggests a longer-term bullish trend, despite recent weakness. The nearest Fibonacci support at $5.76 provides a potential floor, but a break below this level could signal further downside. The market appears to be missing the potential for a technical bounce, given the proximity to key support levels. A key risk that could alter copper's trajectory is the release of U.S. inflation data. Should inflation come in higher than expected, it could prompt the Fed to maintain or even increase its hawkish stance, further strengthening the dollar and pressuring copper prices. Conversely, a lower-than-expected inflation reading could weaken the dollar, providing relief to copper prices and potentially triggering a rally. The market may not be fully pricing in the possibility of a significant shift in inflation expectations, which could lead to abrupt moves in copper. Looking ahead, the upcoming U.S. Consumer Price Index (CPI) release will be pivotal. A CPI reading that deviates significantly from expectations could either confirm the current bearish sentiment or invalidate it by altering the Fed's policy trajectory. Investors should closely monitor this data point, as it will likely dictate the next major move in copper prices.📈 Technical Indicators Summary
RSI (14)
50.9
50-Day MA
$6.09
200-Day MA
$5.49
Fib Level
38.2%
📊 Technical Analysis Chart (18-Month View)
📐 Fibonacci Retracement Analysis
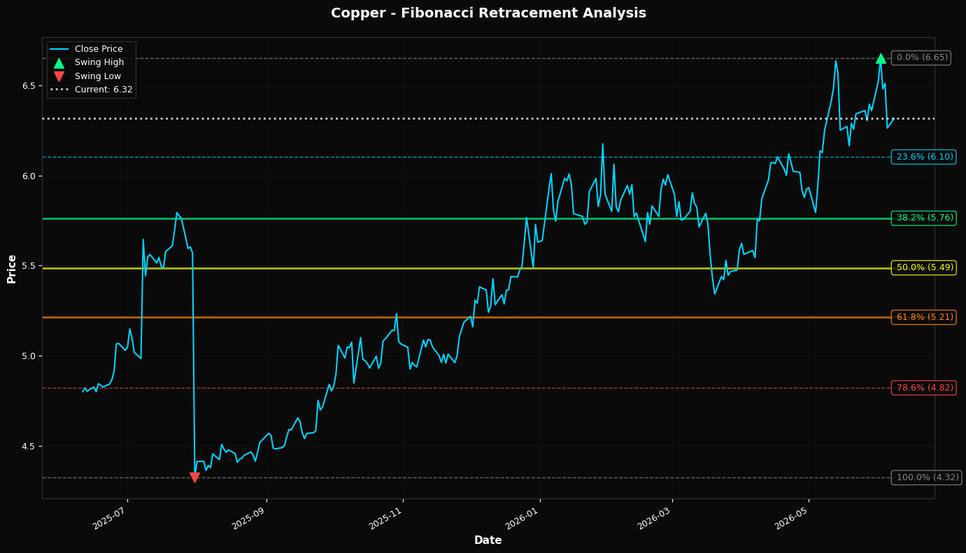
🎯 Key Trading Levels
Key Fibonacci Levels:
- 38.2%: $5.76
- 50.0%: $5.49
- 61.8%: $5.21
Support: $4.32 (Swing Low), $6.09 (50-Day MA)
Resistance: $6.65 (Swing High)
Disclaimer
The content on MarketsFN.com is provided for educational and informational purposes only. It does not constitute financial advice, investment recommendations, or trading guidance. All investments involve risks, and past performance does not guarantee future results. You are solely responsible for your investment decisions and should conduct independent research and consult a qualified financial advisor before acting. MarketsFN.com and its authors are not liable for any losses or damages arising from your use of this information.