Copper: Up 1.4% to $6.62 — Bullish Structure — Above MA50 & MA200
· Commodities · QuoteReporter
Copper: Up 1.4% to $6.62 — Bullish Structure — Above MA50 & MA200
Analysis Date: June 02, 2026
📊 Current Market Data
CURRENT PRICE
$6.62
DAILY CHANGE
+1.44%
WEEKLY CHANGE
+4.04%
52W HIGH
$6.64
52W LOW
$4.32
💡 Key Market Factors
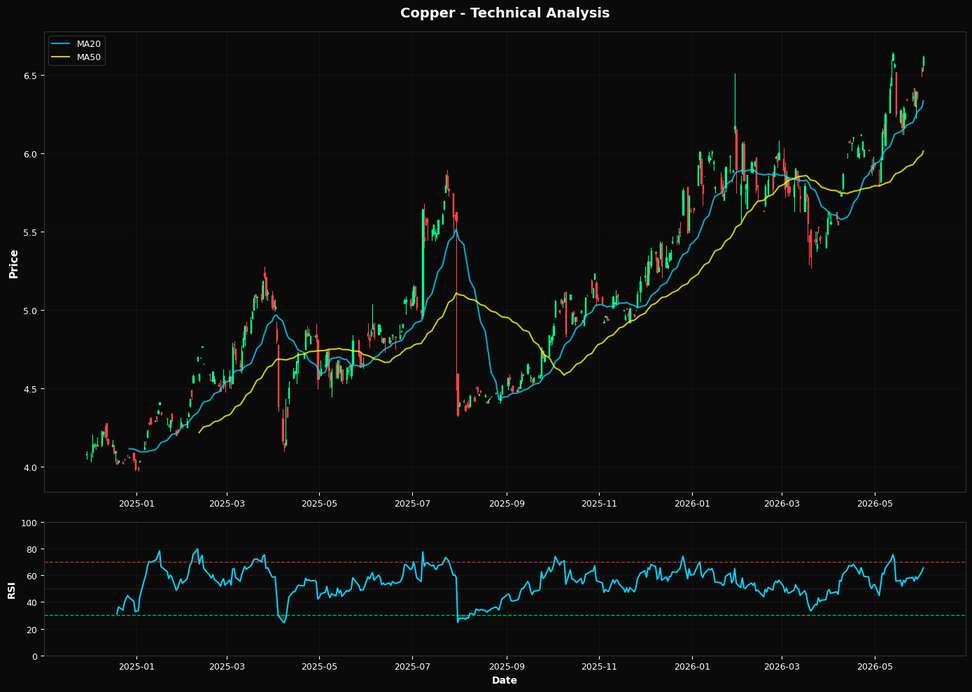
Copper's recent rally, with a weekly gain of +4.04% and a current price of $6.62, is primarily driven by the weakening U.S. dollar, which is the most critical macro driver for this commodity today. As the dollar depreciates, dollar-denominated commodities like copper become cheaper for foreign buyers, boosting demand. This dynamic is particularly relevant given the Federal Reserve's current stance on interest rates. With the Fed signaling a potential pause in rate hikes, the dollar's strength is likely to remain subdued, providing continued support for copper prices. Investors may be underestimating the extent to which a prolonged weaker dollar could sustain this upward momentum in copper. From a technical perspective, copper is showing strong bullish signals. The Relative Strength Index (RSI) at 65.6 suggests that while the commodity is nearing overbought territory, there is still room for further upside before hitting extreme levels. The price is comfortably above its 20-day moving average of $6.33, the 50-day moving average of $6.02, and the 200-day moving average of $5.46, indicating a robust upward trend. The nearest Fibonacci support at the 38.2% retracement level of $5.76 provides a solid foundation, suggesting that any pullbacks could be limited. The proximity to the 52-week high of $6.64 further underscores the potential for a breakout, reinforcing a bullish bias. A key risk that could alter this bullish outlook is a shift in U.S. economic data, particularly any unexpected rise in inflation that might prompt the Federal Reserve to reconsider its current rate policy. Such a development could strengthen the dollar, reversing the supportive conditions for copper. Conversely, a continued decline in inflation or a dovish Fed stance would likely confirm the current bullish trajectory for copper. Looking ahead, the upcoming U.S. Consumer Price Index (CPI) release will be pivotal. A lower-than-expected CPI reading could further weaken the dollar, reinforcing the bullish case for copper. Conversely, a higher-than-expected inflation figure could trigger a reassessment of Fed policy expectations, potentially strengthening the dollar and challenging copper's recent gains. This data point will be crucial in validating or invalidating the current bullish outlook for copper.📈 Technical Indicators Summary
RSI (14)
65.6
50-Day MA
$6.02
200-Day MA
$5.46
Fib Level
38.2%
📊 Technical Analysis Chart (18-Month View)
📐 Fibonacci Retracement Analysis
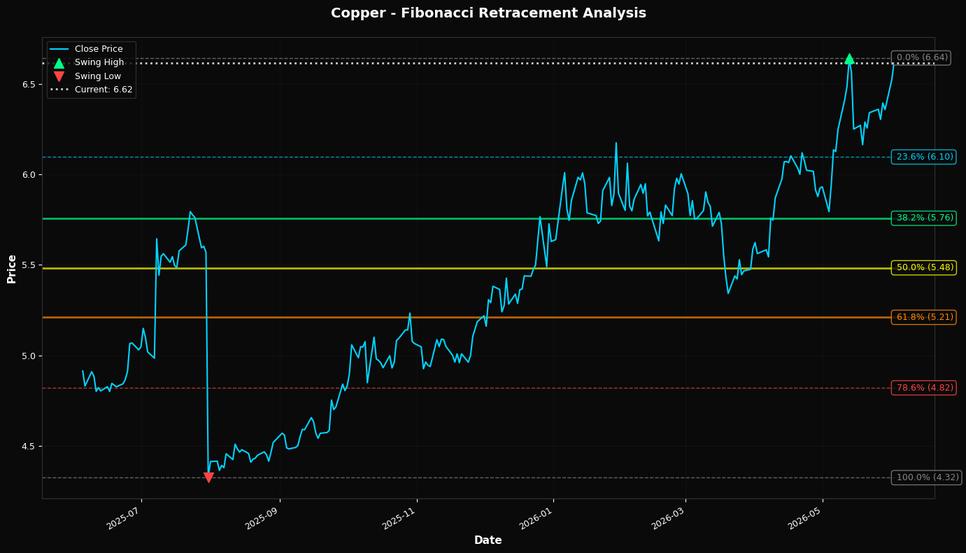
🎯 Key Trading Levels
Key Fibonacci Levels:
- 38.2%: $5.76
- 50.0%: $5.48
- 61.8%: $5.21
Support: $4.32 (Swing Low), $6.02 (50-Day MA)
Resistance: $6.64 (Swing High)
Disclaimer
The content on MarketsFN.com is provided for educational and informational purposes only. It does not constitute financial advice, investment recommendations, or trading guidance. All investments involve risks, and past performance does not guarantee future results. You are solely responsible for your investment decisions and should conduct independent research and consult a qualified financial advisor before acting. MarketsFN.com and its authors are not liable for any losses or damages arising from your use of this information.