Corn: Down 0.4% to $416.00 — Oversold at RSI 27 — Watching for Bounce
· Commodities · QuoteReporter
Corn: Down 0.4% to $416.00 — Oversold at RSI 27 — Watching for Bounce
Analysis Date: June 08, 2026
📊 Current Market Data
CURRENT PRICE
$416.00
DAILY CHANGE
-0.36%
WEEKLY CHANGE
-6.31%
52W HIGH
$481.75
52W LOW
$368.75
💡 Key Market Factors
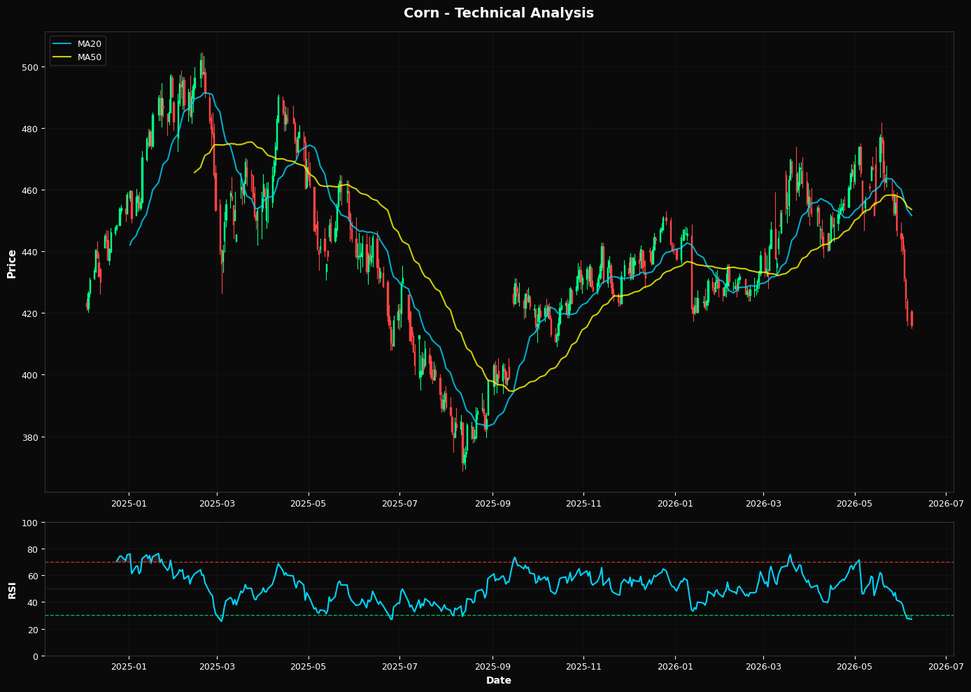
Corn prices are poised for a potential rebound as they hover near critical support levels, with the Relative Strength Index (RSI) signaling oversold conditions. The most pressing macro driver for corn right now is the strength of the U.S. dollar. A strong dollar, driven by the Federal Reserve's hawkish stance on interest rates, has been a significant headwind for corn prices, making U.S. exports less competitive. However, any signs of a dovish pivot by the Fed could weaken the dollar, providing a much-needed boost to corn prices. The market may be underestimating the potential for a shift in Fed policy, which could quickly alter the current bearish sentiment. Technically, corn is trading at $416.00, significantly below its 20-day and 50-day moving averages of $451.59 and $453.56, respectively, indicating a strong downtrend. However, the RSI at 27.1 suggests that corn is oversold, which could lead to a short-term bounce. The nearest Fibonacci support at 61.8% is $411.92, a level that could act as a springboard for prices. Given these technical indicators, there is a directional bias towards a corrective rally, especially if prices hold above this Fibonacci level. The market may be missing the potential for a technical rebound, given the oversold conditions and proximity to key support. A key risk that could alter this outlook is the upcoming USDA report on crop yields. If the report indicates higher-than-expected yields, it could exacerbate the current supply glut, pushing prices lower. Conversely, any indication of reduced yields due to adverse weather conditions could tighten supply and support a price recovery. The market appears to be underpricing the impact of potential supply disruptions, focusing instead on the current bearish trend. Looking ahead, the next Federal Reserve meeting will be crucial. Any indication of a pause or slowdown in rate hikes could weaken the dollar, providing a tailwind for corn prices. This event will be pivotal in confirming or invalidating the current technical setup and macroeconomic influences. Investors should closely monitor Fed communications for any signs of a policy shift that could catalyze a reversal in corn's fortunes.📈 Technical Indicators Summary
RSI (14)
27.1
50-Day MA
$453.56
200-Day MA
$435.05
Fib Level
61.8%
📊 Technical Analysis Chart (18-Month View)
📐 Fibonacci Retracement Analysis
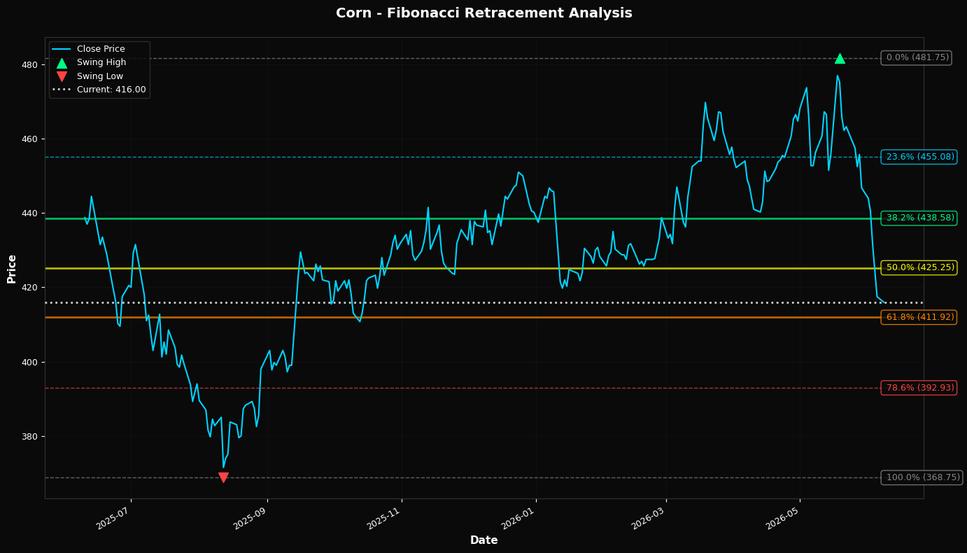
🎯 Key Trading Levels
Key Fibonacci Levels:
- 38.2%: $438.58
- 50.0%: $425.25
- 61.8%: $411.92
Support: $368.75 (Swing Low), $453.56 (50-Day MA)
Resistance: $481.75 (Swing High)
Disclaimer
The content on MarketsFN.com is provided for educational and informational purposes only. It does not constitute financial advice, investment recommendations, or trading guidance. All investments involve risks, and past performance does not guarantee future results. You are solely responsible for your investment decisions and should conduct independent research and consult a qualified financial advisor before acting. MarketsFN.com and its authors are not liable for any losses or damages arising from your use of this information.