Corn: Down 0.5% to $422.25 — Oversold at RSI 29 — Watching for Bounce
· Commodities · QuoteReporter
Corn: Down 0.5% to $422.25 — Oversold at RSI 29 — Watching for Bounce
Analysis Date: June 05, 2026
📊 Current Market Data
CURRENT PRICE
$422.25
DAILY CHANGE
-0.53%
WEEKLY CHANGE
-5.48%
52W HIGH
$481.75
52W LOW
$368.75
💡 Key Market Factors
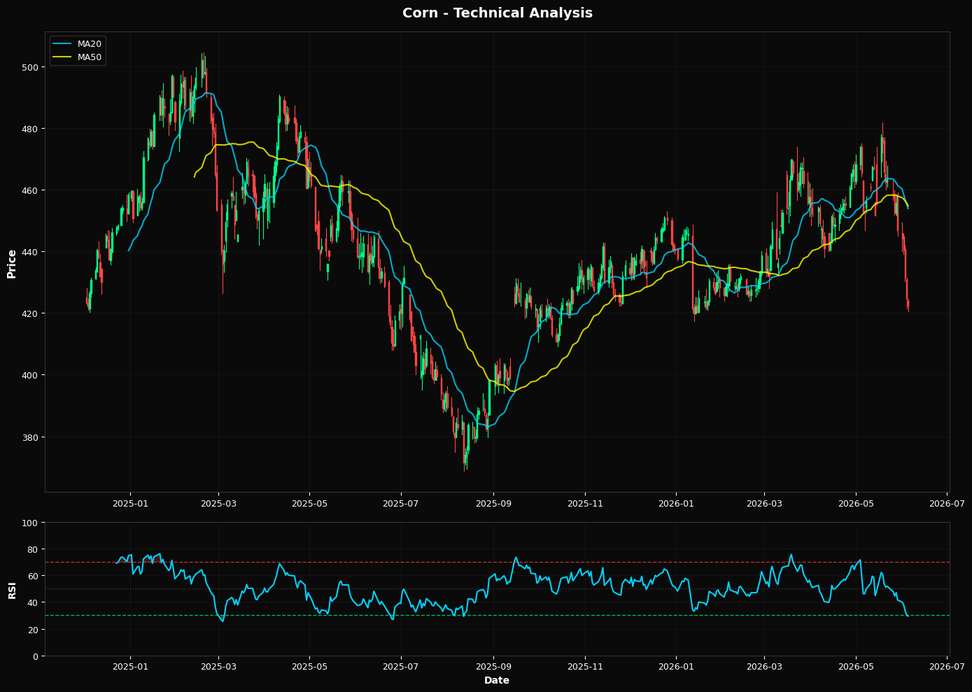
Corn prices are under significant pressure, with a notable weekly decline of -5.48%, driven primarily by the strengthening U.S. dollar. The USD's appreciation is the most critical macro driver impacting corn today, as it makes U.S. exports more expensive on the global market, reducing demand. This currency dynamic is exacerbating the downward pressure on corn prices, which are already struggling at $422.25, well below the 20-day moving average of $453.84. The market may be underestimating the extent to which a strong dollar can continue to suppress U.S. agricultural exports, particularly if the Federal Reserve maintains its current interest rate stance, further supporting the dollar. From a technical perspective, corn is in a bearish phase. The Relative Strength Index (RSI) is at 29.4, indicating that corn is oversold. This suggests potential for a short-term bounce, but the broader trend remains negative. The price is below both the 50-day and 200-day moving averages, which are $454.67 and $434.89, respectively, reinforcing the bearish outlook. The nearest Fibonacci support level at 50.0% is $425.25, which corn has breached, signaling further downside risk. The market's failure to hold this support could lead to a test of the 52-week low at $368.75, unless a significant reversal catalyst emerges. A key risk that could alter the current bearish trajectory is a shift in Federal Reserve policy. If upcoming economic data, such as the next inflation report, suggests a cooling economy, the Fed might pivot to a more dovish stance. This could weaken the dollar, making U.S. corn more competitive globally and potentially reversing the current price decline. The market may not be fully pricing in the possibility of a Fed pivot, which could lead to a rapid reassessment of corn's value. Looking ahead, the next U.S. inflation report will be crucial. A lower-than-expected inflation figure could prompt a dovish shift from the Fed, weakening the dollar and providing relief to corn prices. Conversely, persistent inflation would likely reinforce the current strong dollar environment, maintaining pressure on corn. This report will be a decisive factor in confirming or invalidating the current bearish outlook for corn.📈 Technical Indicators Summary
RSI (14)
29.4
50-Day MA
$454.67
200-Day MA
$434.89
Fib Level
50.0%
📊 Technical Analysis Chart (18-Month View)
📐 Fibonacci Retracement Analysis
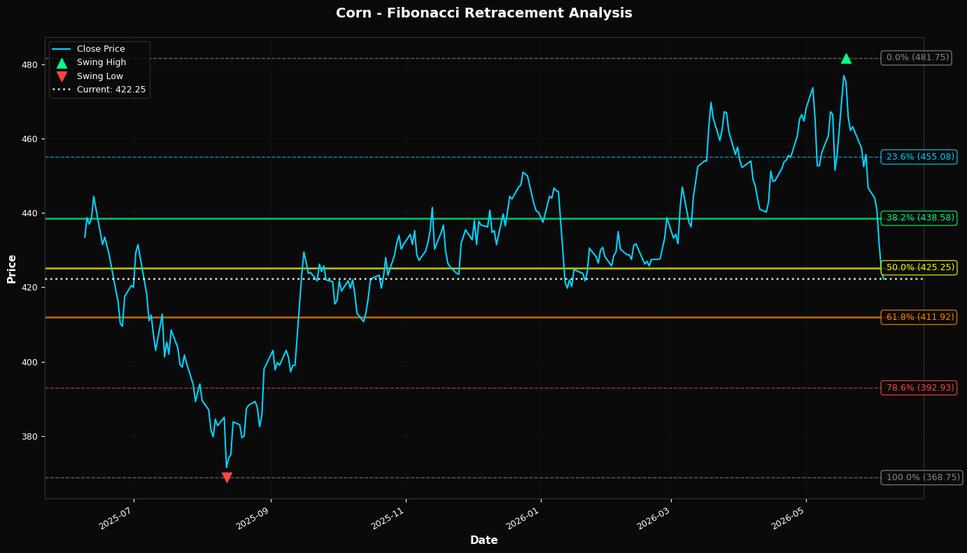
🎯 Key Trading Levels
Key Fibonacci Levels:
- 38.2%: $438.58
- 50.0%: $425.25
- 61.8%: $411.92
Support: $368.75 (Swing Low), $454.67 (50-Day MA)
Resistance: $481.75 (Swing High)
Disclaimer
The content on MarketsFN.com is provided for educational and informational purposes only. It does not constitute financial advice, investment recommendations, or trading guidance. All investments involve risks, and past performance does not guarantee future results. You are solely responsible for your investment decisions and should conduct independent research and consult a qualified financial advisor before acting. MarketsFN.com and its authors are not liable for any losses or damages arising from your use of this information.