Corn: Down 0.7% to $441.00 — Testing 38.2% Fibonacci Support
· Commodities · QuoteReporter
Corn: Down 0.7% to $441.00 — Testing 38.2% Fibonacci Support
Analysis Date: June 02, 2026
📊 Current Market Data
CURRENT PRICE
$441.00
DAILY CHANGE
-0.68%
WEEKLY CHANGE
-3.61%
52W HIGH
$481.75
52W LOW
$368.75
💡 Key Market Factors
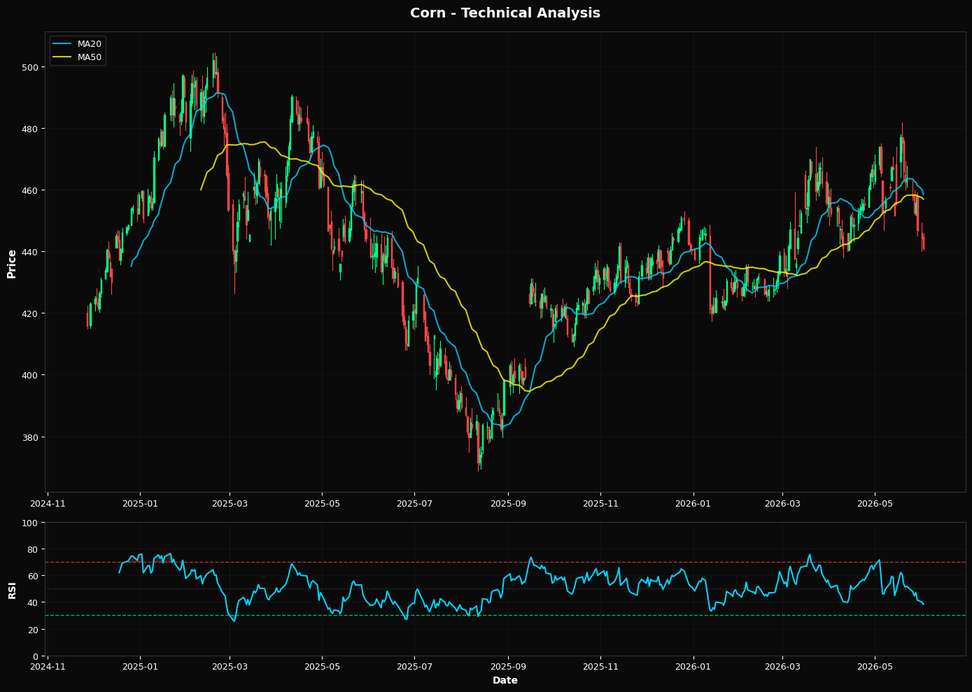
Corn prices are under pressure, with the most critical factor being the strength of the U.S. dollar. As corn is priced in dollars, a stronger USD makes U.S. exports less competitive, directly impacting demand. Currently, corn is trading at $441.00, down 0.68% daily and 3.61% weekly. The dollar's strength, driven by the Federal Reserve's hawkish stance on interest rates, is a significant headwind. With inflation still a concern, the Fed's commitment to maintaining higher rates for longer is likely to keep the dollar elevated, further weighing on corn prices. From a technical perspective, corn is showing bearish signals. The Relative Strength Index (RSI) is at 38.2, indicating that the commodity is nearing oversold territory but not quite there yet. The price is below both the 20-day moving average ($458.50) and the 50-day moving average ($456.90), suggesting a short-term downtrend. However, it remains above the 200-day moving average ($434.23), which could act as a longer-term support. The nearest Fibonacci support level is at $438.58, which is crucial; a break below this could accelerate the decline towards the 200-day moving average. The technical setup suggests a bearish bias unless the price can reclaim the 50-day moving average. A key risk that could alter this bearish outlook is a shift in U.S. monetary policy. If upcoming economic data, such as the Consumer Price Index (CPI), shows a significant drop in inflation, it could prompt the Fed to reconsider its rate hike trajectory. This would likely weaken the dollar, providing relief to corn prices. Conversely, stronger-than-expected inflation data would reinforce the Fed's current stance, keeping the dollar strong and corn under pressure. The market may be underpricing the potential impact of geopolitical tensions on corn supply chains. Any disruption in major corn-producing regions could tighten supply, providing a bullish counterforce to the current bearish sentiment. The upcoming USDA World Agricultural Supply and Demand Estimates (WASDE) report will be pivotal. A revision in global supply forecasts could either confirm the bearish trend or provide a catalyst for a reversal. Investors should watch this report closely, as it will offer critical insights into both supply dynamics and potential shifts in demand.📈 Technical Indicators Summary
RSI (14)
38.2
50-Day MA
$456.90
200-Day MA
$434.23
Fib Level
38.2%
📊 Technical Analysis Chart (18-Month View)
📐 Fibonacci Retracement Analysis
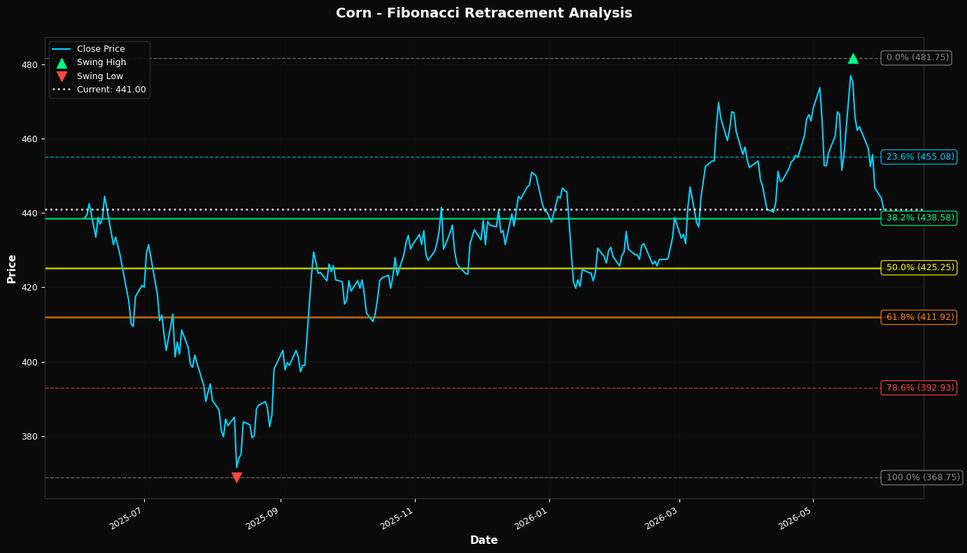
🎯 Key Trading Levels
Key Fibonacci Levels:
- 38.2%: $438.58
- 50.0%: $425.25
- 61.8%: $411.92
Support: $368.75 (Swing Low), $456.90 (50-Day MA)
Resistance: $481.75 (Swing High)
Disclaimer
The content on MarketsFN.com is provided for educational and informational purposes only. It does not constitute financial advice, investment recommendations, or trading guidance. All investments involve risks, and past performance does not guarantee future results. You are solely responsible for your investment decisions and should conduct independent research and consult a qualified financial advisor before acting. MarketsFN.com and its authors are not liable for any losses or damages arising from your use of this information.