Corn: Down 1.4% to $411.75 — Testing 61.8% Fibonacci Support
· Commodities · QuoteReporter
Corn: Down 1.4% to $411.75 — Testing 61.8% Fibonacci Support
Analysis Date: June 22, 2026
📊 Current Market Data
CURRENT PRICE
$411.75
DAILY CHANGE
-1.38%
WEEKLY CHANGE
-0.24%
52W HIGH
$481.75
52W LOW
$368.75
💡 Key Market Factors
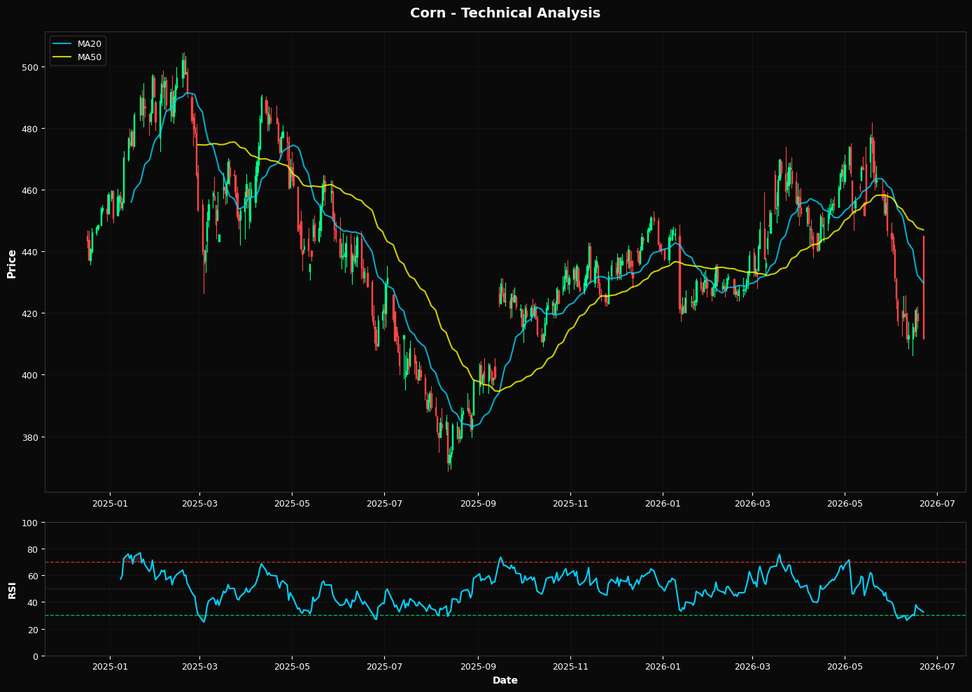
Corn prices are teetering on a critical support level, with the nearest Fibonacci retracement at 61.8% positioned at $411.92. This suggests a precarious technical setup where a breach could trigger further downside momentum. The most pressing macro driver influencing corn today is the strength of the U.S. dollar. A robust dollar, often a byproduct of hawkish Federal Reserve policy, exerts downward pressure on commodity prices by making them more expensive for foreign buyers. Given the current macroeconomic environment, where the Fed remains vigilant on inflation, the dollar's strength is likely to persist, posing a continued headwind for corn prices. From a technical perspective, corn's Relative Strength Index (RSI) at 32.5 indicates that the commodity is approaching oversold territory. This could suggest a potential for a short-term bounce. However, the price is significantly below its 20-day moving average of $429.75, as well as the 50-day and 200-day moving averages at $446.94 and $436.18, respectively. This bearish alignment of moving averages underscores a strong downward trend. The proximity of the current price to the Fibonacci support at $411.92 is crucial; a failure to hold this level could lead to a test of the 52-week low at $368.75, reinforcing a bearish outlook. A key risk that could alter the current bearish sentiment is a shift in U.S. monetary policy. Should the Federal Reserve signal a pause or pivot in its rate-hiking cycle, it could weaken the dollar, providing relief to corn prices. Additionally, any unexpected disruptions in supply, such as adverse weather conditions in major corn-producing regions, could also act as a bullish catalyst. These factors are currently underappreciated by the market, which seems overly focused on the prevailing strong dollar narrative. Looking ahead, the upcoming Federal Reserve meeting will be pivotal. Any dovish signals that suggest a slowdown in rate hikes could validate a reversal in the dollar's strength, potentially providing a much-needed boost to corn prices. Conversely, continued hawkish rhetoric would likely confirm the bearish trend, pushing prices further down. Investors should closely monitor Fed communications for any shifts in tone that could impact the dollar and, by extension, corn's price trajectory.📈 Technical Indicators Summary
RSI (14)
32.5
50-Day MA
$446.94
200-Day MA
$436.18
Fib Level
61.8%
📊 Technical Analysis Chart (18-Month View)
📐 Fibonacci Retracement Analysis
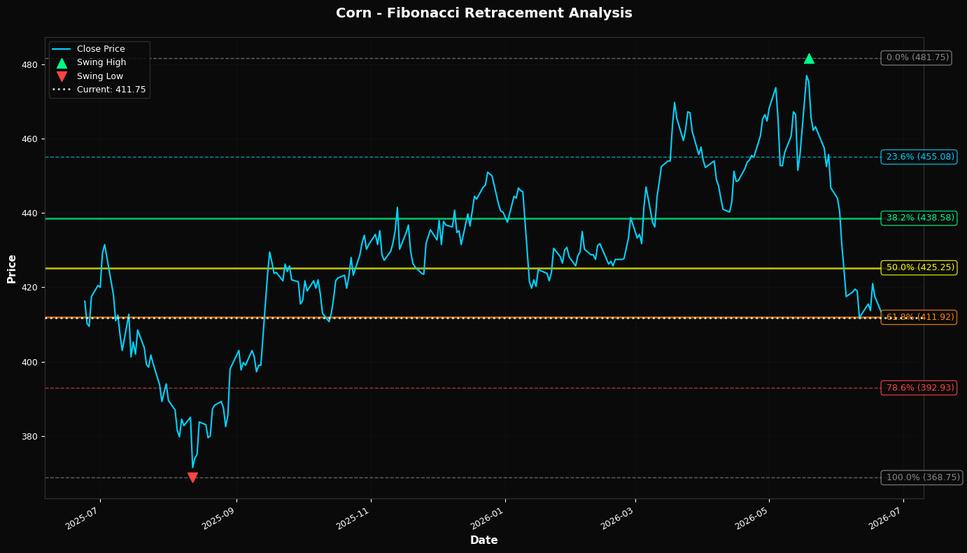
🎯 Key Trading Levels
Key Fibonacci Levels:
- 38.2%: $438.58
- 50.0%: $425.25
- 61.8%: $411.92
Support: $368.75 (Swing Low), $446.94 (50-Day MA)
Resistance: $481.75 (Swing High)
Disclaimer
The content on MarketsFN.com is provided for educational and informational purposes only. It does not constitute financial advice, investment recommendations, or trading guidance. All investments involve risks, and past performance does not guarantee future results. You are solely responsible for your investment decisions and should conduct independent research and consult a qualified financial advisor before acting. MarketsFN.com and its authors are not liable for any losses or damages arising from your use of this information.