Corn Rallies 3.3% amid overbought conditions, near 61.8% Fibonacci support
· Commodities · MarketsFN Team
Corn Rallies 3.3% amid overbought conditions, near 61.8% Fibonacci support
Analysis Date: February 27, 2026
📊 Current Market Data
CURRENT PRICE
$447.50
DAILY CHANGE
+3.29%
WEEKLY CHANGE
+4.68%
52W HIGH
$490.75
52W LOW
$368.75
💡 Key Market Factors
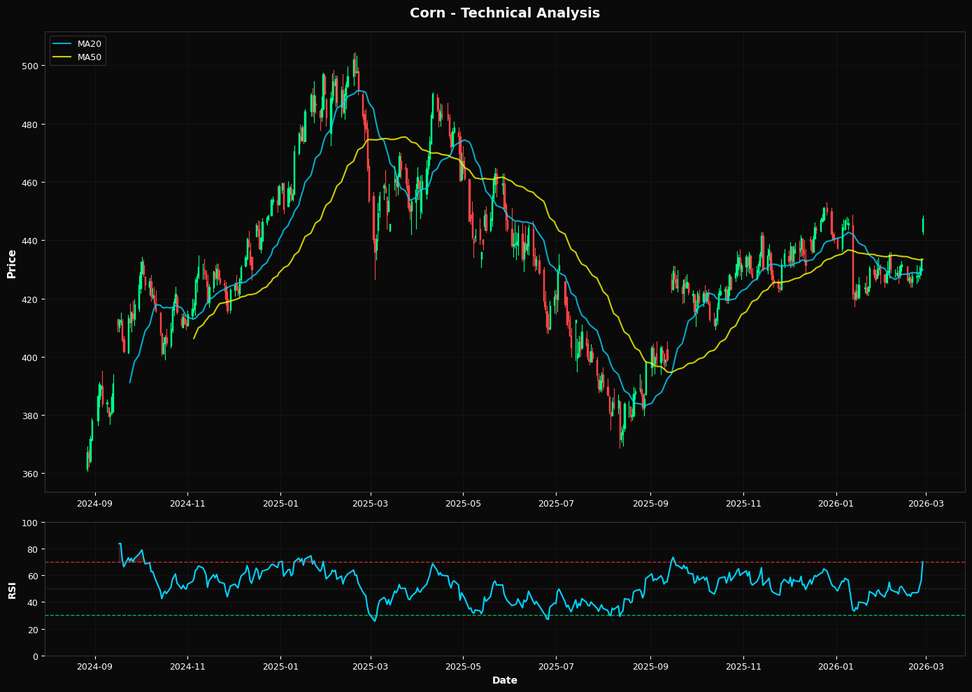
Corn prices have experienced a notable increase, currently trading at $447.50, reflecting a daily gain of 3.29% and a weekly rise of 4.68%. This upward momentum is partly driven by inflationary pressures, as higher input costs in agriculture, such as fuel and fertilizers, are pushing prices up. Additionally, expectations of persistent inflation may lead to increased demand for commodities like corn as a hedge, further supporting prices. Interest rate policy remains a critical factor for corn markets. The Federal Reserve's recent indications of maintaining higher interest rates for an extended period could dampen economic growth prospects, potentially impacting demand for corn, particularly in biofuel production. However, the current price momentum suggests that these concerns are not yet weighing heavily on market sentiment. From a technical perspective, corn is exhibiting bullish signals. The price has broken above the 61.8% Fibonacci retracement level at $444.15, suggesting potential for further gains. The RSI at 70.1 indicates overbought conditions, warranting caution for potential pullbacks. Nonetheless, the price remains above both the 20-day and 50-day moving averages, reinforcing the current upward trend.📈 Technical Indicators Summary
RSI (14)
70.1
50-Day MA
$433.40
200-Day MA
$422.53
Fib Level
61.8%
📊 Technical Analysis Chart (18-Month View)
📐 Fibonacci Retracement Analysis
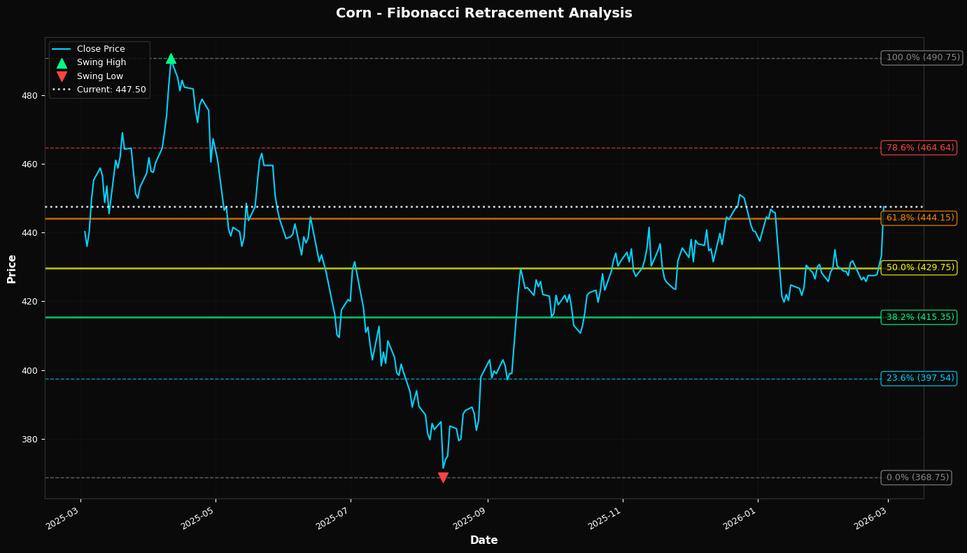
🎯 Key Trading Levels
Key Fibonacci Levels:
- 38.2% Level: $415.35
- 50.0% Level: $429.75
- 61.8% Level: $444.15
Support: $368.75 (Swing Low), $433.40 (50-day MA)
Resistance: $490.75 (Swing High)
Disclaimer
The content on MarketsFN.com is provided for educational and informational purposes only. It does not constitute financial advice, investment recommendations, or trading guidance. All investments involve risks, and past performance does not guarantee future results. You are solely responsible for your investment decisions and should conduct independent research and consult a qualified financial advisor before acting. MarketsFN.com and its authors are not liable for any losses or damages arising from your use of this information.