Corn: Up 0.0% to $409.75 — Testing 61.8% Fibonacci Support
· Commodities · QuoteReporter
Corn: Up 0.0% to $409.75 — Testing 61.8% Fibonacci Support
Analysis Date: June 24, 2026
📊 Current Market Data
CURRENT PRICE
$409.75
DAILY CHANGE
+0.00%
WEEKLY CHANGE
-0.97%
52W HIGH
$481.75
52W LOW
$368.75
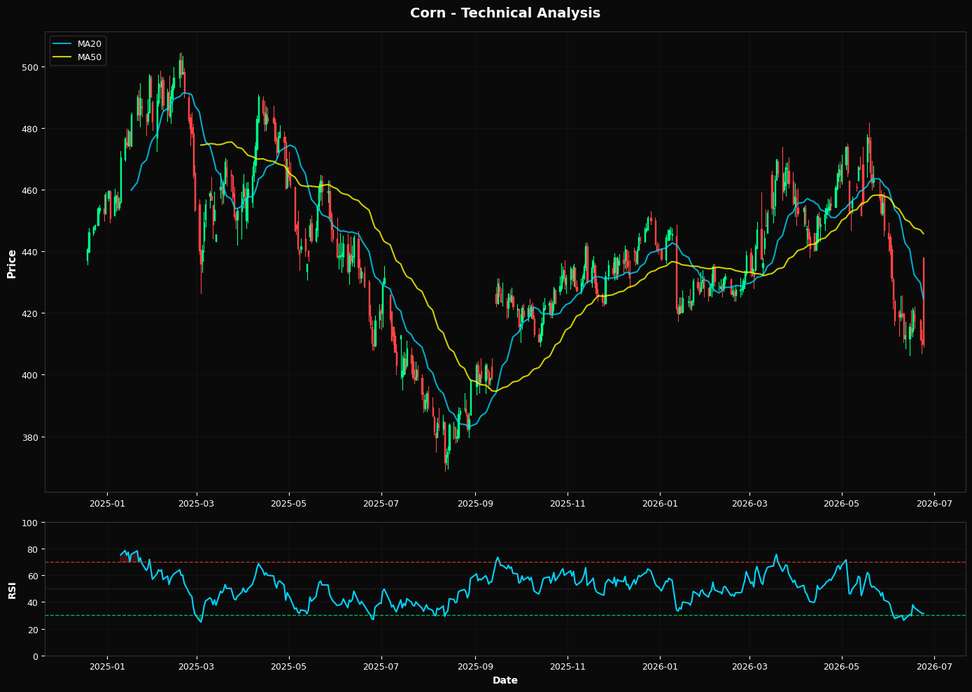
💡 Key Market Factors
Corn prices are teetering on a critical support level, with the nearest Fibonacci retracement at 61.8% ($411.92) just above the current price of $409.75. This suggests a precarious position where any further weakness could trigger a more significant downside move. The most pressing macro driver for corn right now is the strength of the U.S. dollar. A robust USD can suppress corn prices by making U.S. exports less competitive globally. With the Federal Reserve maintaining a hawkish stance on interest rates to combat inflation, the dollar's strength is likely to persist, exerting downward pressure on corn prices. From a technical perspective, corn is in a bearish phase. The Relative Strength Index (RSI) at 31.4 indicates that corn is approaching oversold territory, yet it hasn't reached the extreme levels that typically precede a reversal. The current price is significantly below the 20-day ($424.68), 50-day ($445.69), and 200-day ($436.28) moving averages, underscoring a strong bearish trend. The failure to hold above the 61.8% Fibonacci level could lead to a test of the 52-week low at $368.75, suggesting further downside risk. A key risk that could alter the current bearish outlook is a shift in U.S. monetary policy. If upcoming economic data, such as the Consumer Price Index (CPI), shows a significant decline in inflation, it could prompt the Federal Reserve to adopt a more dovish stance. This would likely weaken the USD, providing relief to corn prices by enhancing the competitiveness of U.S. exports. The market may be underpricing the potential for such a shift, given the current focus on persistent inflation. The upcoming release of the CPI will be crucial in confirming or invalidating this view. A lower-than-expected inflation reading could signal a turning point, potentially easing the Fed's aggressive rate hike trajectory and weakening the dollar. This would likely provide a much-needed boost to corn prices, challenging the current bearish technical setup. Conversely, if inflation remains stubbornly high, the bearish trend could intensify, pushing corn prices toward the 52-week low.📈 Technical Indicators Summary
RSI (14)
31.4
50-Day MA
$445.69
200-Day MA
$436.28
Fib Level
61.8%
📊 Technical Analysis Chart (18-Month View)
📐 Fibonacci Retracement Analysis
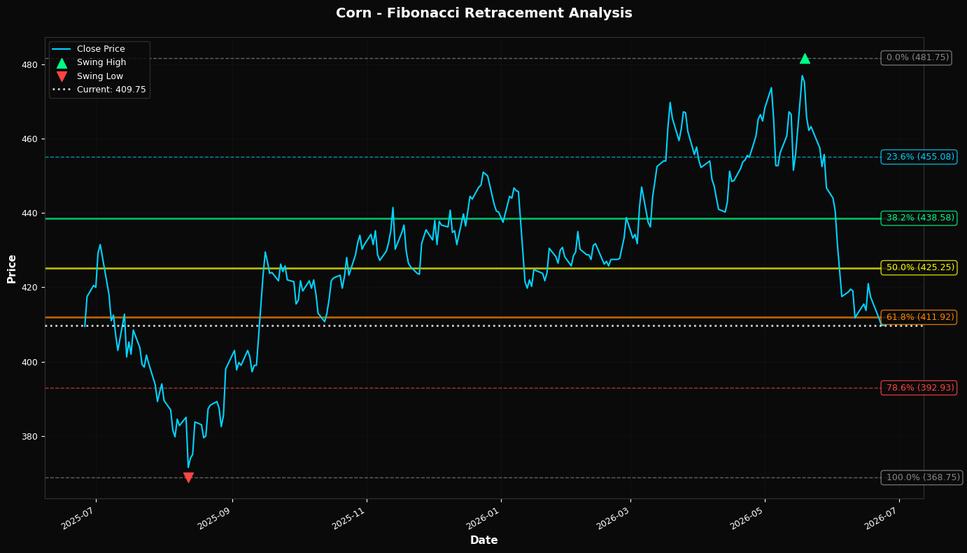
🎯 Key Trading Levels
Key Fibonacci Levels:
- 38.2%: $438.58
- 50.0%: $425.25
- 61.8%: $411.92
Support: $368.75 (Swing Low), $445.69 (50-Day MA)
Resistance: $481.75 (Swing High)
Disclaimer
The content on MarketsFN.com is provided for educational and informational purposes only. It does not constitute financial advice, investment recommendations, or trading guidance. All investments involve risks, and past performance does not guarantee future results. You are solely responsible for your investment decisions and should conduct independent research and consult a qualified financial advisor before acting. MarketsFN.com and its authors are not liable for any losses or damages arising from your use of this information.