Corn: Up 0.4% to $420.50 — Testing 50.0% Fibonacci Support
· Commodities · QuoteReporter
Corn: Up 0.4% to $420.50 — Testing 50.0% Fibonacci Support
Analysis Date: June 09, 2026
📊 Current Market Data
CURRENT PRICE
$420.50
DAILY CHANGE
+0.42%
WEEKLY CHANGE
-4.54%
52W HIGH
$481.75
52W LOW
$368.75
💡 Key Market Factors
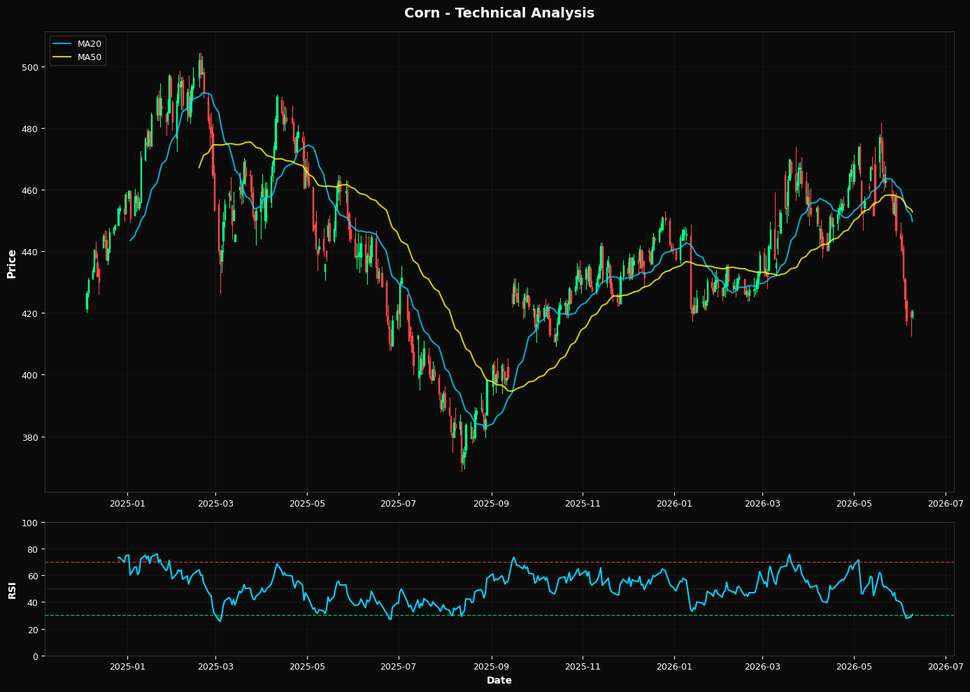
Corn prices are teetering on a critical support level, with the market potentially underestimating the impact of a strengthening U.S. dollar. The USD's appreciation is exerting downward pressure on corn prices, as it makes U.S. exports less competitive globally. This is particularly significant given the current macroeconomic environment where inflationary pressures are easing, and the Federal Reserve is maintaining a hawkish stance on interest rates. The Fed's commitment to keeping rates elevated to combat inflation is bolstering the dollar, which in turn, is a headwind for commodities priced in USD, like corn. This dynamic is crucial as it could further suppress corn prices, especially if the dollar continues to strengthen. From a technical perspective, corn is showing signs of being oversold, with the RSI(14) at 30.7, indicating potential for a rebound. However, the price is currently below all major moving averages, with the MA20 at $449.71, MA50 at $452.78, and MA200 at $435.23, suggesting a bearish trend. The nearest Fibonacci support at 50.0% is at $425.25, which is slightly above the current price of $420.50. This level could act as a short-term support, but failure to hold above it might lead to further declines. The market's current positioning below the MA200 reinforces a bearish outlook, and any sustained move below the Fibonacci level could accelerate the downward momentum. A key risk that could alter this bearish outlook is a sudden shift in U.S. monetary policy. If upcoming economic data, such as employment figures or inflation reports, suggest a weakening economy, the Fed might pivot to a more dovish stance. This could weaken the dollar, providing relief to corn prices by making U.S. exports more attractive. Conversely, stronger-than-expected economic data could reinforce the Fed's current policy, further pressuring corn prices. The upcoming release of U.S. employment data will be pivotal in shaping the near-term direction for corn. A weaker-than-expected jobs report could prompt a reassessment of the Fed's rate trajectory, potentially weakening the dollar and providing a tailwind for corn prices. Conversely, robust employment figures would likely support the Fed's hawkish stance, maintaining pressure on corn. This data point will be crucial in confirming or invalidating the current bearish outlook, making it a must-watch for market participants.📈 Technical Indicators Summary
RSI (14)
30.7
50-Day MA
$452.78
200-Day MA
$435.23
Fib Level
50.0%
📊 Technical Analysis Chart (18-Month View)
📐 Fibonacci Retracement Analysis
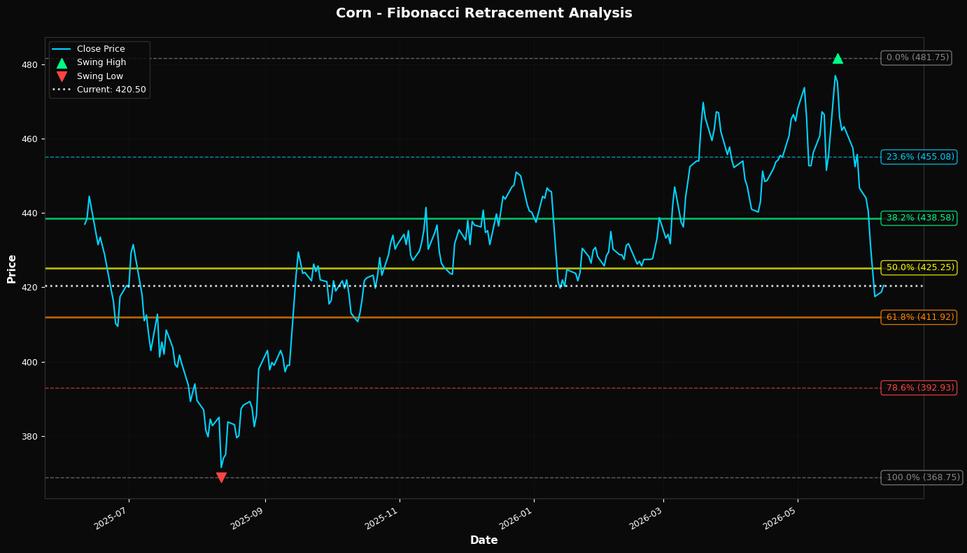
🎯 Key Trading Levels
Key Fibonacci Levels:
- 38.2%: $438.58
- 50.0%: $425.25
- 61.8%: $411.92
Support: $368.75 (Swing Low), $452.78 (50-Day MA)
Resistance: $481.75 (Swing High)
Disclaimer
The content on MarketsFN.com is provided for educational and informational purposes only. It does not constitute financial advice, investment recommendations, or trading guidance. All investments involve risks, and past performance does not guarantee future results. You are solely responsible for your investment decisions and should conduct independent research and consult a qualified financial advisor before acting. MarketsFN.com and its authors are not liable for any losses or damages arising from your use of this information.