Corn: Up 0.7% to $415.50 — Testing 61.8% Fibonacci Support
· Commodities · QuoteReporter
Corn: Up 0.7% to $415.50 — Testing 61.8% Fibonacci Support
Analysis Date: June 15, 2026
📊 Current Market Data
CURRENT PRICE
$415.50
DAILY CHANGE
+0.67%
WEEKLY CHANGE
-0.78%
52W HIGH
$481.75
52W LOW
$368.75
💡 Key Market Factors
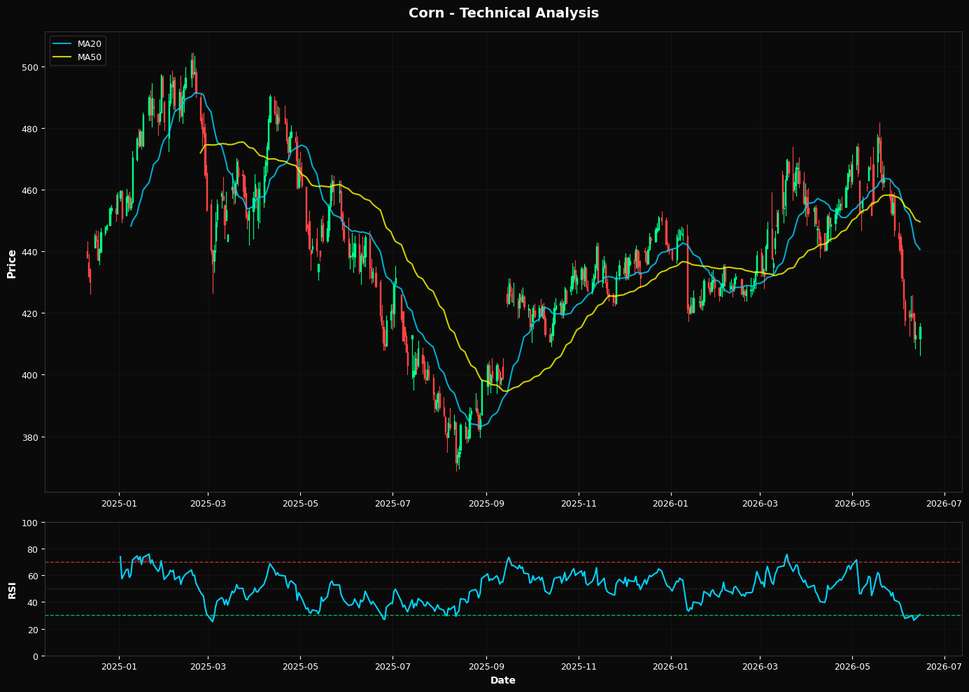
Corn prices are poised for a potential rebound, with the Relative Strength Index (RSI) at 30.6 signaling oversold conditions. This technical indicator suggests that the recent downward pressure, evidenced by a weekly decline of 0.78%, may be overdone. The current price of $415.50 is also hovering near a critical Fibonacci support level at $411.92, which could act as a springboard for a recovery. Given these technical signals, the market may be underestimating the potential for a short-term bounce. In the macroeconomic landscape, the strength of the U.S. dollar is the most significant factor impacting corn prices. A strong dollar typically makes U.S. commodities more expensive for foreign buyers, dampening demand. With the Federal Reserve maintaining a hawkish stance on interest rates, the dollar has remained robust, exerting downward pressure on corn. However, any signs of a dovish pivot by the Fed could weaken the dollar, providing a tailwind for corn prices. Investors should closely watch upcoming Fed communications for any hints of a policy shift. The technical setup for corn is intriguing. The price is below both the 20-day moving average of $440.56 and the 50-day moving average of $449.54, indicating a bearish trend. However, the proximity to the 61.8% Fibonacci retracement level at $411.92 suggests a potential support zone. If corn can hold above this level, it might attract buying interest, especially given the oversold RSI. The 200-day moving average at $435.78 serves as a longer-term resistance, and a break above this could signal a more sustained upward move. A key risk to this outlook is the upcoming U.S. Department of Agriculture (USDA) report on crop yields. Should the report indicate higher-than-expected yields, it could exacerbate the current supply glut, pushing prices lower. Conversely, if the report reveals tighter supply conditions, it could catalyze a price rally. This report will be crucial in confirming or challenging the current technical and macroeconomic narratives surrounding corn.📈 Technical Indicators Summary
RSI (14)
30.6
50-Day MA
$449.54
200-Day MA
$435.78
Fib Level
61.8%
📊 Technical Analysis Chart (18-Month View)
📐 Fibonacci Retracement Analysis
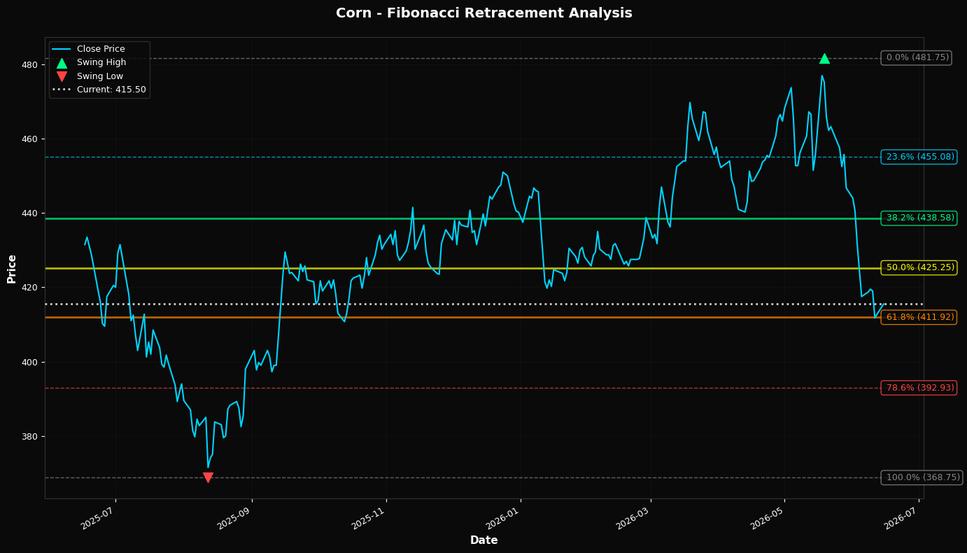
🎯 Key Trading Levels
Key Fibonacci Levels:
- 38.2%: $438.58
- 50.0%: $425.25
- 61.8%: $411.92
Support: $368.75 (Swing Low), $449.54 (50-Day MA)
Resistance: $481.75 (Swing High)
Disclaimer
The content on MarketsFN.com is provided for educational and informational purposes only. It does not constitute financial advice, investment recommendations, or trading guidance. All investments involve risks, and past performance does not guarantee future results. You are solely responsible for your investment decisions and should conduct independent research and consult a qualified financial advisor before acting. MarketsFN.com and its authors are not liable for any losses or damages arising from your use of this information.