Corn: Up 2.0% to $415.00 — Testing 61.8% Fibonacci Support
· Commodities · QuoteReporter
Corn: Up 2.0% to $415.00 — Testing 61.8% Fibonacci Support
Analysis Date: June 25, 2026
📊 Current Market Data
CURRENT PRICE
$415.00
DAILY CHANGE
+1.97%
WEEKLY CHANGE
-1.43%
52W HIGH
$481.75
52W LOW
$368.75
💡 Key Market Factors
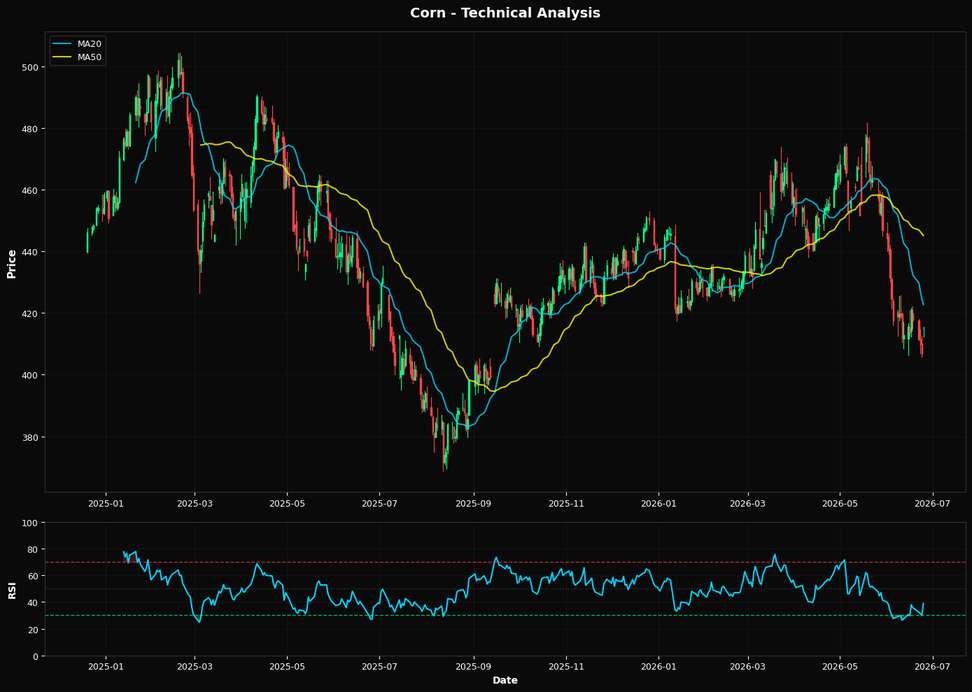
Corn prices are poised for a potential rebound, with the nearest Fibonacci support at $411.92 providing a critical juncture for a bullish reversal. The most pressing macro driver for corn right now is the strength of the U.S. dollar. A strong dollar typically pressures commodity prices by making them more expensive for foreign buyers. However, with the corn price at $415.00, just above the Fibonacci support, any weakening in the dollar could catalyze a price recovery. The market may be underestimating the potential for a dollar pullback, especially if the Federal Reserve signals a pause or slowdown in rate hikes, which could ease upward pressure on the dollar. From a technical perspective, corn is showing signs of being oversold, with an RSI of 38.9, indicating potential for a price bounce. The current price of $415.00 is below all major moving averages—MA20 at $422.66, MA50 at $445.08, and MA200 at $436.32—suggesting a bearish trend. However, the proximity to the 61.8% Fibonacci retracement level at $411.92 could act as a strong support, potentially reversing the recent downtrend. The market's failure to break below this level decisively could signal a shift in momentum, providing a tactical buying opportunity for traders anticipating a rebound. A key risk to this outlook is the upcoming U.S. crop yield reports. Should these reports indicate higher-than-expected yields, it could exacerbate the current supply glut, pushing prices lower and invalidating the support at the Fibonacci level. Conversely, any indication of lower yields could tighten supply expectations and support a price rally. The market may not be fully pricing in the potential for adverse weather conditions to impact yields, which could serve as a bullish catalyst. Looking ahead, the next Federal Reserve meeting will be crucial. Any dovish shift in Fed policy could weaken the dollar, providing a tailwind for corn prices. Confirmation of this view would come from a sustained break above the MA20 at $422.66, signaling a potential trend reversal. Conversely, a break below the Fibonacci support at $411.92 would invalidate the bullish thesis and suggest further downside risk.📈 Technical Indicators Summary
RSI (14)
38.9
50-Day MA
$445.08
200-Day MA
$436.32
Fib Level
61.8%
📊 Technical Analysis Chart (18-Month View)
📐 Fibonacci Retracement Analysis
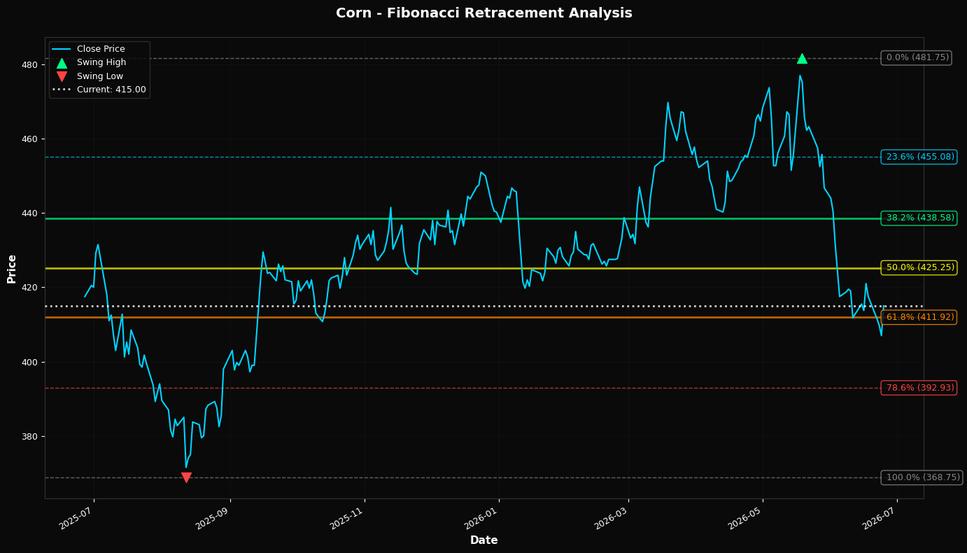
🎯 Key Trading Levels
Key Fibonacci Levels:
- 38.2%: $438.58
- 50.0%: $425.25
- 61.8%: $411.92
Support: $368.75 (Swing Low), $445.08 (50-Day MA)
Resistance: $481.75 (Swing High)
Disclaimer
The content on MarketsFN.com is provided for educational and informational purposes only. It does not constitute financial advice, investment recommendations, or trading guidance. All investments involve risks, and past performance does not guarantee future results. You are solely responsible for your investment decisions and should conduct independent research and consult a qualified financial advisor before acting. MarketsFN.com and its authors are not liable for any losses or damages arising from your use of this information.