Corn: Up 4.9% to $469.25 — Bullish Structure — Above MA50 & MA200
· Commodities · QuoteReporter
Corn: Up 4.9% to $469.25 — Bullish Structure — Above MA50 & MA200
Analysis Date: July 16, 2026
📊 Current Market Data
CURRENT PRICE
$469.25
DAILY CHANGE
+4.86%
WEEKLY CHANGE
+9.70%
52W HIGH
$481.75
52W LOW
$368.75
💡 Key Market Factors
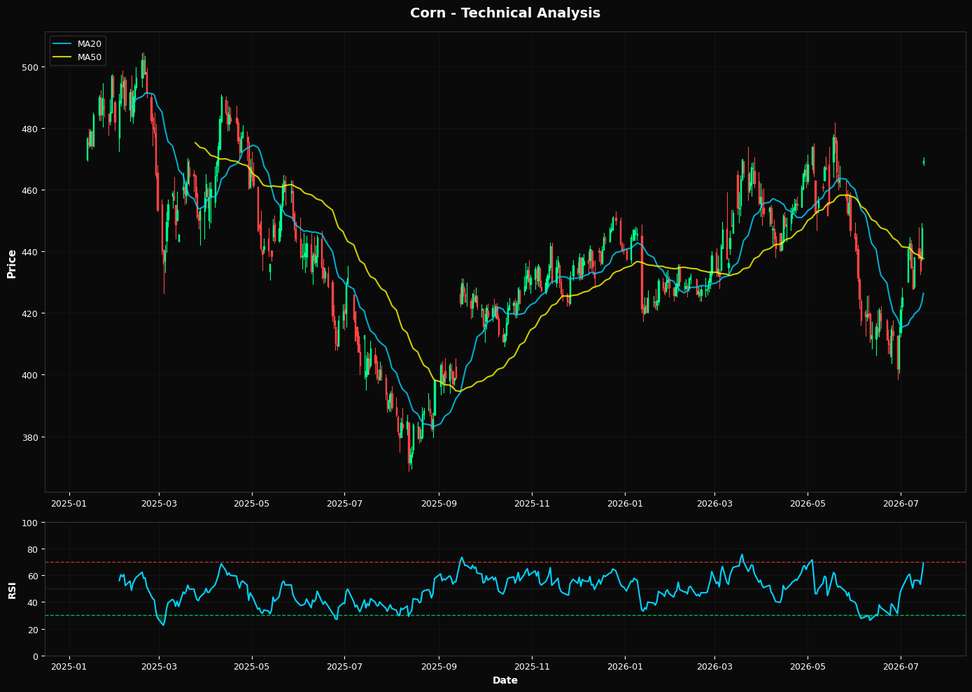
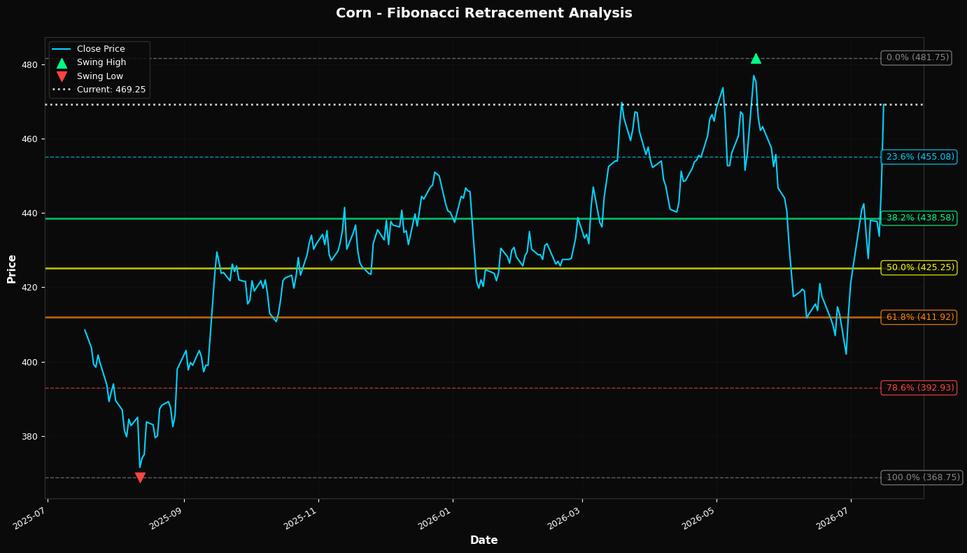
Corn prices are surging, with a notable daily increase of 4.86% and a weekly gain of 9.70%, driven primarily by the weakening U.S. dollar. As the USD depreciates, U.S. agricultural exports become more competitive globally, boosting demand for commodities like corn. This dynamic is crucial right now, as it directly impacts the purchasing power of international buyers and can sustain the current price rally. Given the Federal Reserve's recent dovish stance, signaling a potential pause in rate hikes, the dollar may continue to weaken, providing further tailwinds for corn prices. From a technical perspective, corn is exhibiting bullish momentum. The RSI(14) is at 68.9, approaching overbought territory, which suggests strong upward momentum but also warns of potential near-term exhaustion. The current price of $469.25 is well above the 20-day moving average of $426.35, the 50-day moving average of $437.62, and the 200-day moving average of $437.33, indicating a robust upward trend. The nearest Fibonacci support at 38.2% is at $438.58, which aligns closely with the 50-day and 200-day moving averages, providing a solid support level. This technical setup suggests a continued upward bias, with the potential to retest the 52-week high of $481.75 if momentum persists. A key risk to this bullish outlook is the upcoming USDA crop report, which could significantly alter supply expectations. If the report indicates higher-than-expected yields or an increase in planted acreage, it could dampen the current rally by alleviating supply concerns. Conversely, any indication of reduced supply could propel prices even higher, reinforcing the current bullish trend. The market may be underpricing the potential impact of adverse weather conditions on crop yields, which could exacerbate supply constraints. Looking ahead, the next major catalyst will be the release of the USDA crop report. This data point will either confirm the current bullish trajectory or introduce new supply-side dynamics that could alter the price outlook. Investors should closely monitor this report, as it will provide critical insights into the balance of supply and demand in the corn market, potentially validating or challenging the current price momentum.📈 Technical Indicators Summary
RSI (14)
68.9
50-Day MA
$437.62
200-Day MA
$437.33
Fib Level
38.2%
📊 Technical Analysis Chart (18-Month View)
📐 Fibonacci Retracement Analysis
🎯 Key Trading Levels
Key Fibonacci Levels:
- 38.2%: $438.58
- 50.0%: $425.25
- 61.8%: $411.92
Support: $368.75 (Swing Low), $437.62 (50-Day MA)
Resistance: $481.75 (Swing High)
Disclaimer
The content on MarketsFN.com is provided for educational and informational purposes only. It does not constitute financial advice, investment recommendations, or trading guidance. All investments involve risks, and past performance does not guarantee future results. You are solely responsible for your investment decisions and should conduct independent research and consult a qualified financial advisor before acting. MarketsFN.com and its authors are not liable for any losses or damages arising from your use of this information.