Cotton: Down 0.5% to $73.39 — Testing 50.0% Fibonacci Support
· Commodities · QuoteReporter
Cotton: Down 0.5% to $73.39 — Testing 50.0% Fibonacci Support
Analysis Date: June 09, 2026
📊 Current Market Data
CURRENT PRICE
$73.39
DAILY CHANGE
-0.49%
WEEKLY CHANGE
-4.24%
52W HIGH
$88.88
52W LOW
$60.71
💡 Key Market Factors
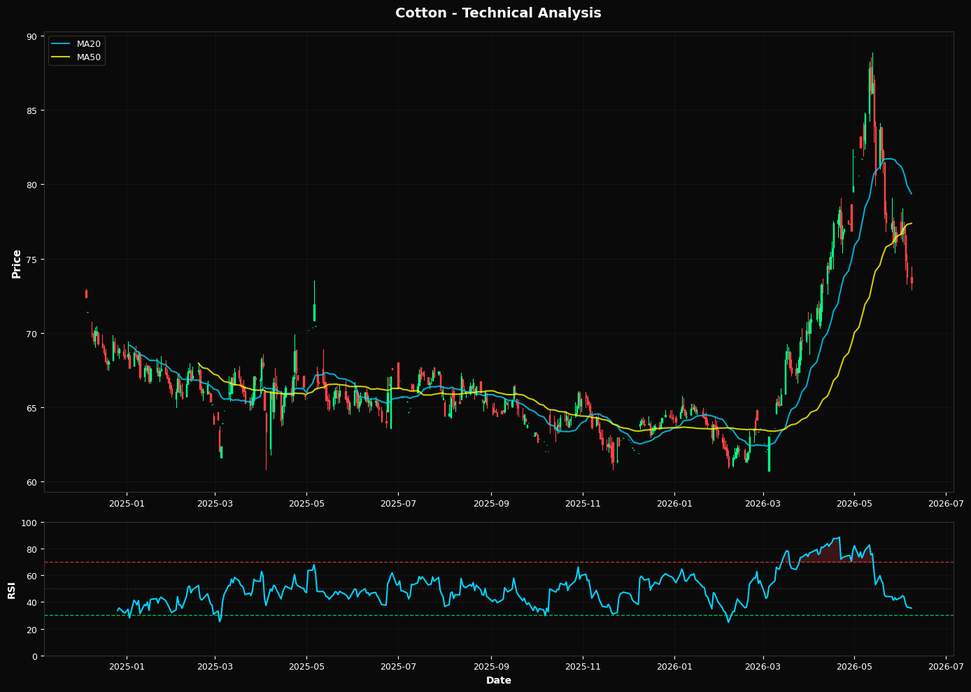
Cotton prices are under pressure, with the most critical factor being the strength of the U.S. dollar. As cotton is priced in dollars, a stronger USD makes it more expensive for foreign buyers, dampening demand. Currently, the dollar's strength is exacerbated by the Federal Reserve's hawkish stance on interest rates, which is likely to persist given ongoing inflation concerns. This macroeconomic backdrop is pivotal, as it directly impacts cotton's competitiveness on the global market. The market may be underestimating the prolonged impact of a strong dollar, which could continue to suppress cotton prices beyond immediate expectations. From a technical perspective, cotton is in a bearish phase. The Relative Strength Index (RSI) at 35.4 suggests that the commodity is approaching oversold territory, but not quite there yet. This indicates potential for further downside before a reversal. The current price of $73.39 is below both the 20-day moving average ($79.37) and the 50-day moving average ($77.37), reinforcing a bearish trend. However, it remains above the 200-day moving average ($67.38), which could act as a long-term support. The nearest Fibonacci support level at 50.0% is $74.79, which has already been breached, signaling potential for further declines. The technical setup suggests a continuation of the downward trend unless a significant catalyst emerges. A key risk that could alter the current bearish outlook is a shift in U.S. monetary policy. If the Federal Reserve signals a pause or reversal in rate hikes, this could weaken the dollar, making cotton more attractive to international buyers and potentially reversing the current price trend. Additionally, any unexpected disruptions in supply, such as adverse weather conditions affecting major cotton-producing regions, could also serve as a bullish catalyst. Looking ahead, the upcoming Federal Reserve meeting will be crucial. Any indication of a dovish shift could validate a bullish reversal in cotton prices. Conversely, continued hawkish rhetoric would likely confirm the current bearish trajectory. Investors should closely monitor Fed communications for clues on future rate policy, as this will be the primary driver of cotton's price direction in the near term.📈 Technical Indicators Summary
RSI (14)
35.4
50-Day MA
$77.37
200-Day MA
$67.38
Fib Level
50.0%
📊 Technical Analysis Chart (18-Month View)
📐 Fibonacci Retracement Analysis
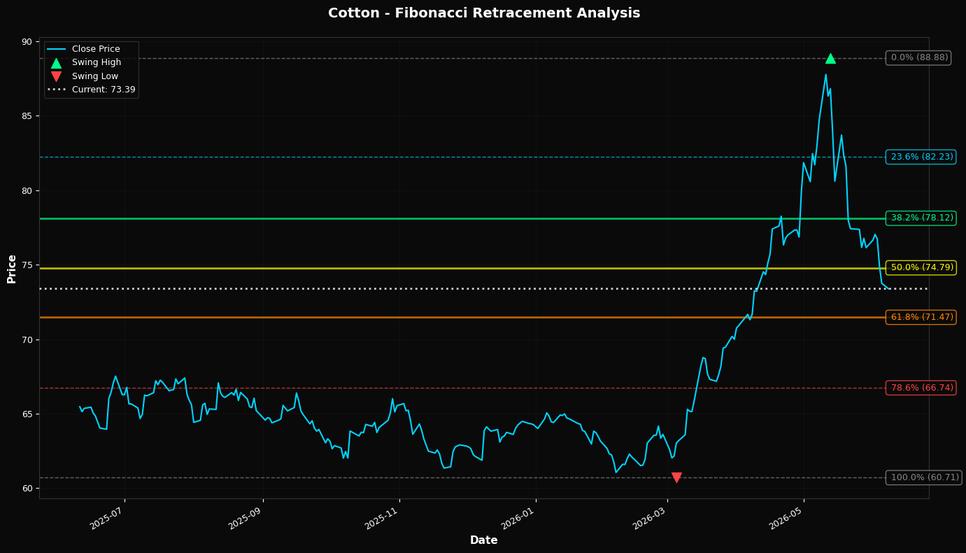
🎯 Key Trading Levels
Key Fibonacci Levels:
- 38.2%: $78.12
- 50.0%: $74.79
- 61.8%: $71.47
Support: $60.71 (Swing Low), $77.37 (50-Day MA)
Resistance: $88.88 (Swing High)
Disclaimer
The content on MarketsFN.com is provided for educational and informational purposes only. It does not constitute financial advice, investment recommendations, or trading guidance. All investments involve risks, and past performance does not guarantee future results. You are solely responsible for your investment decisions and should conduct independent research and consult a qualified financial advisor before acting. MarketsFN.com and its authors are not liable for any losses or damages arising from your use of this information.