Cotton: Down 2.4% to $74.89 — Testing 50.0% Fibonacci Support
· Commodities · QuoteReporter
Cotton: Down 2.4% to $74.89 — Testing 50.0% Fibonacci Support
Analysis Date: June 05, 2026
📊 Current Market Data
CURRENT PRICE
$74.89
DAILY CHANGE
-2.40%
WEEKLY CHANGE
-2.45%
52W HIGH
$88.88
52W LOW
$60.71
💡 Key Market Factors
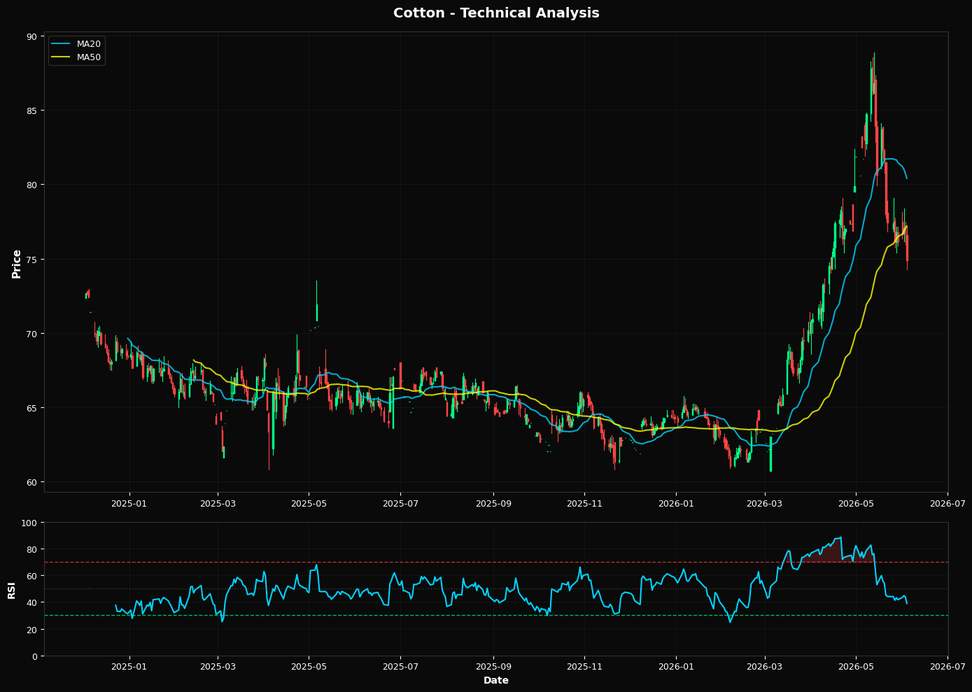
Cotton prices are at a critical juncture, with the commodity trading at $74.89, just above the 50.0% Fibonacci support level at $74.79. This suggests a potential inflection point, as the market tests a key technical support amid broader macroeconomic pressures. The most pressing macro driver for cotton right now is the strength of the U.S. dollar. A stronger dollar, often a result of hawkish Federal Reserve policy, makes U.S. exports like cotton more expensive on the global market, potentially dampening demand. Given the Fed's current stance on interest rates, any further tightening could exacerbate this pressure, keeping cotton prices under downward pressure. From a technical perspective, cotton's Relative Strength Index (RSI) of 38.9 indicates that the commodity is approaching oversold territory, suggesting a potential for a rebound. However, the price is below both the 20-day moving average of $80.40 and the 50-day moving average of $77.18, signaling a bearish trend in the short to medium term. The fact that the price remains above the 200-day moving average of $67.31 provides some longer-term support, but the immediate focus is on whether the $74.79 Fibonacci level can hold. If this support fails, it could trigger further selling pressure, pushing prices closer to the 52-week low of $60.71. A key risk that could alter the current bearish outlook is a shift in U.S. monetary policy. Should the Federal Reserve signal a pause or reversal in its rate hikes, the dollar could weaken, providing relief to U.S. cotton exporters and potentially boosting prices. Conversely, any indication of continued rate hikes could strengthen the dollar further, exacerbating the current downtrend. Additionally, unexpected changes in global cotton demand, perhaps due to geopolitical developments or shifts in major economies like China, could also serve as significant catalysts. Looking ahead, the upcoming Federal Reserve meeting will be crucial. Any dovish signals could validate a bullish reversal, especially if the RSI continues to hover near oversold levels. Conversely, a reaffirmation of a hawkish stance could confirm the bearish trend, potentially leading to a breach of the $74.79 support. Investors should closely monitor the Fed's language and any economic data that might influence its policy direction, as these will be pivotal in determining the next move for cotton prices.📈 Technical Indicators Summary
RSI (14)
38.9
50-Day MA
$77.18
200-Day MA
$67.31
Fib Level
50.0%
📊 Technical Analysis Chart (18-Month View)
📐 Fibonacci Retracement Analysis
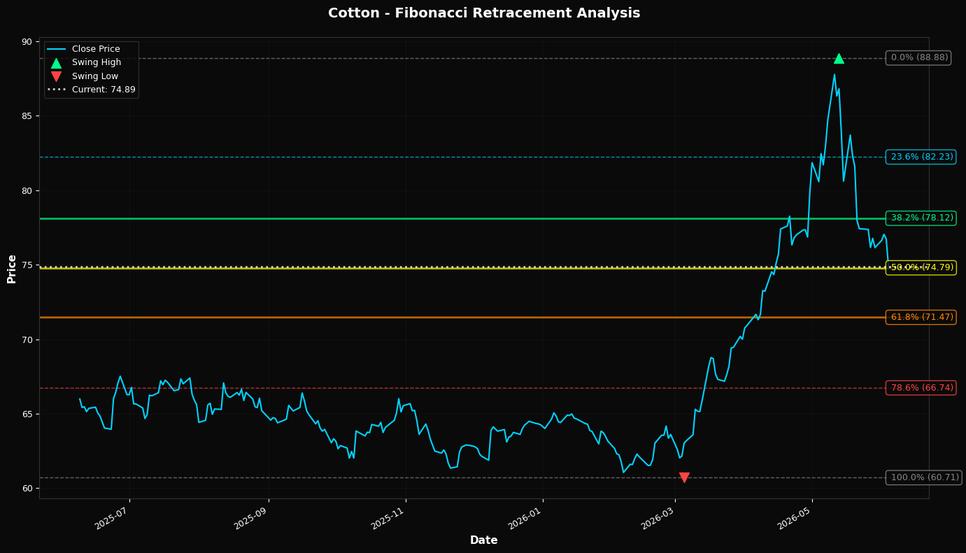
🎯 Key Trading Levels
Key Fibonacci Levels:
- 38.2%: $78.12
- 50.0%: $74.79
- 61.8%: $71.47
Support: $60.71 (Swing Low), $77.18 (50-Day MA)
Resistance: $88.88 (Swing High)
Disclaimer
The content on MarketsFN.com is provided for educational and informational purposes only. It does not constitute financial advice, investment recommendations, or trading guidance. All investments involve risks, and past performance does not guarantee future results. You are solely responsible for your investment decisions and should conduct independent research and consult a qualified financial advisor before acting. MarketsFN.com and its authors are not liable for any losses or damages arising from your use of this information.