Cotton Rallies 3.0% near 38.2% Fibonacci support
· Commodities · MarketsFN Team
Cotton Rallies 3.0% near 38.2% Fibonacci support
Analysis Date: February 27, 2026
📊 Current Market Data
CURRENT PRICE
$65.27
DAILY CHANGE
+3.01%
WEEKLY CHANGE
+3.55%
52W HIGH
$73.50
52W LOW
$60.79
💡 Key Market Factors
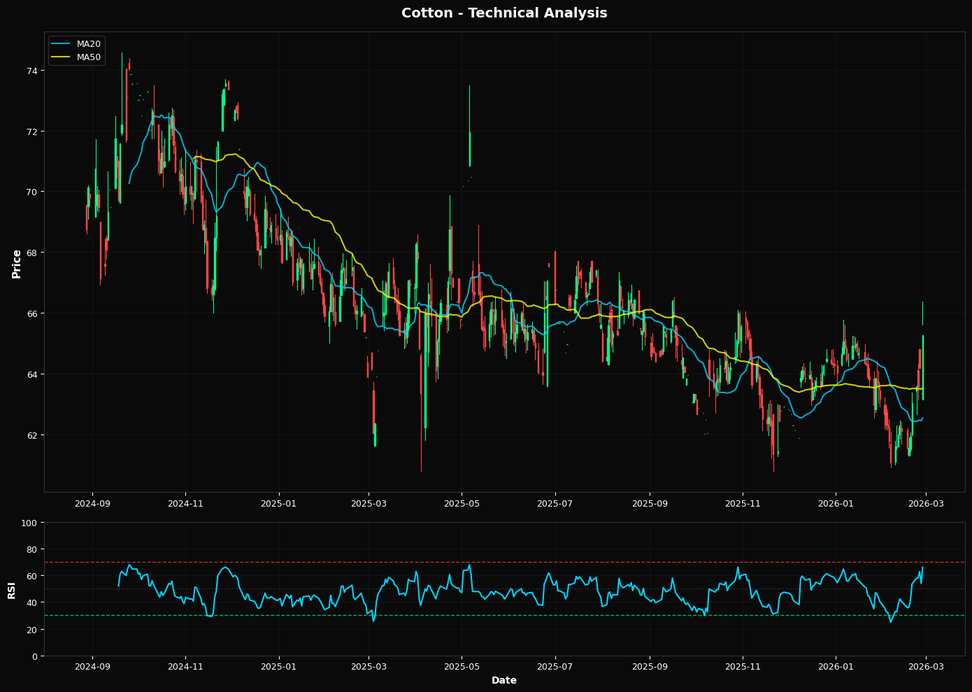
Cotton prices have recently experienced a notable uptick, with a daily change of +3.01% and a weekly gain of +3.55%. This movement is partially influenced by inflation expectations, as higher input costs for producers are being passed through to the market, supporting price increases. However, inflationary pressures are somewhat moderated by a strong dollar, which can dampen export competitiveness. Interest rate dynamics are also playing a crucial role. The Federal Reserve's stance on maintaining higher interest rates to combat inflation is strengthening the dollar, potentially curbing international demand for U.S. cotton. This could limit further price gains despite the current bullish momentum. From a technical perspective, cotton is trading above both its 20-day and 50-day moving averages, indicating a short-term bullish trend. The RSI at 66.0 suggests that the commodity is approaching overbought territory, which could lead to a price correction. The nearest Fibonacci resistance level at 38.2% is $65.65, which, if breached, could signal further upward potential, while serving as a critical resistance point.📈 Technical Indicators Summary
RSI (14)
66.0
50-Day MA
$63.52
200-Day MA
$64.51
Fib Level
38.2%
📊 Technical Analysis Chart (18-Month View)
📐 Fibonacci Retracement Analysis
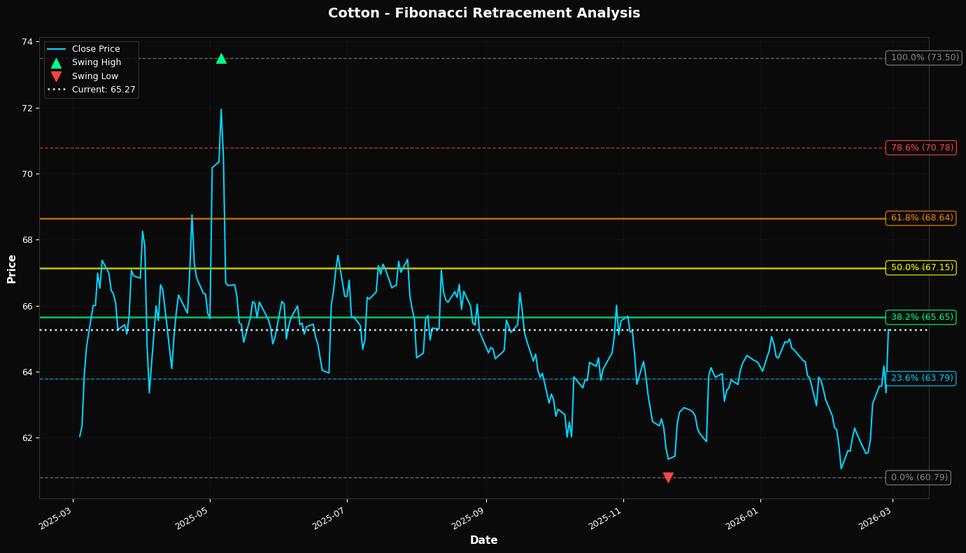
🎯 Key Trading Levels
Key Fibonacci Levels:
- 38.2% Level: $65.65
- 50.0% Level: $67.15
- 61.8% Level: $68.64
Support: $60.79 (Swing Low), $63.52 (50-day MA)
Resistance: $73.50 (Swing High)
Disclaimer
The content on MarketsFN.com is provided for educational and informational purposes only. It does not constitute financial advice, investment recommendations, or trading guidance. All investments involve risks, and past performance does not guarantee future results. You are solely responsible for your investment decisions and should conduct independent research and consult a qualified financial advisor before acting. MarketsFN.com and its authors are not liable for any losses or damages arising from your use of this information.