Cotton: Up 4.6% to $78.45 — Testing 38.2% Fibonacci Support
· Commodities · QuoteReporter
Cotton: Up 4.6% to $78.45 — Testing 38.2% Fibonacci Support
Analysis Date: June 17, 2026
📊 Current Market Data
CURRENT PRICE
$78.45
DAILY CHANGE
+4.59%
WEEKLY CHANGE
+10.34%
52W HIGH
$88.88
52W LOW
$60.71
💡 Key Market Factors
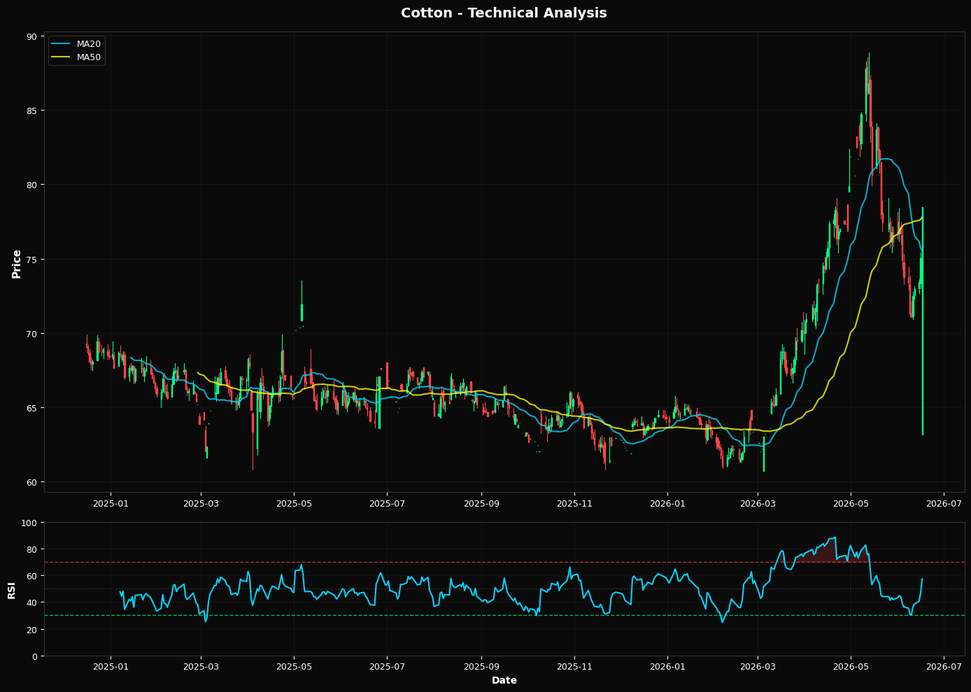
Cotton prices are surging, with a notable daily increase of 4.59% and a weekly gain of 10.34%, signaling a potential bullish shift driven by macroeconomic factors. The most significant driver in the current environment is the U.S. dollar's dynamics. A weaker dollar typically boosts commodity prices, including cotton, by making them cheaper for foreign buyers. Given the Federal Reserve's recent dovish signals, suggesting a potential pause or slowdown in rate hikes, the dollar could face downward pressure, further supporting cotton prices. This macro backdrop is crucial as it directly impacts global demand and pricing power for U.S. cotton exports. From a technical perspective, cotton's current price of $78.45 sits above its 20-day moving average of $75.53 and slightly above the 50-day moving average of $77.78, indicating short-term bullish momentum. The Relative Strength Index (RSI) at 57.2 suggests that the commodity is not yet overbought, leaving room for further upside. The nearest Fibonacci support at 38.2% is at $78.12, which has been breached, reinforcing the bullish sentiment. The alignment of these technical indicators suggests a continuation of the upward trend, with the next significant resistance potentially at the 52-week high of $88.88. A key risk to this bullish outlook is the potential for unexpected changes in U.S. monetary policy or a sudden strengthening of the dollar. Such a shift could dampen the current rally by making U.S. cotton less competitive globally. Additionally, any significant changes in global trade policies or tariffs affecting major cotton importers could alter demand dynamics abruptly. The market may be underpricing the risk of geopolitical tensions that could disrupt supply chains or alter trade flows, impacting cotton prices. Looking ahead, the upcoming U.S. inflation data release will be pivotal. If inflation remains subdued, it could reinforce expectations of a dovish Fed stance, supporting the current bullish trend in cotton. Conversely, a surprise uptick in inflation could reignite fears of further rate hikes, potentially strengthening the dollar and putting downward pressure on cotton prices. This data point will be crucial in confirming or challenging the current market sentiment and directional bias.📈 Technical Indicators Summary
RSI (14)
57.2
50-Day MA
$77.78
200-Day MA
$67.65
Fib Level
38.2%
📊 Technical Analysis Chart (18-Month View)
📐 Fibonacci Retracement Analysis
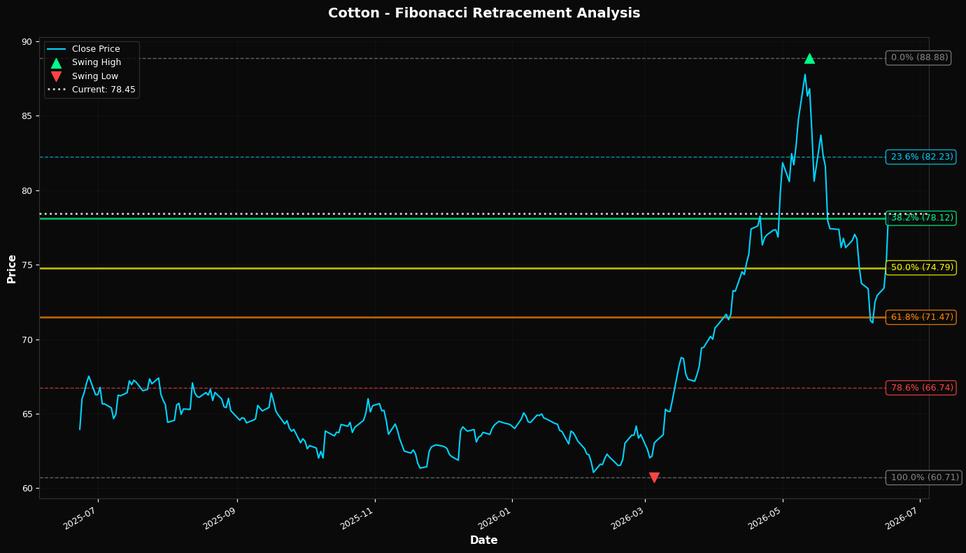
🎯 Key Trading Levels
Key Fibonacci Levels:
- 38.2%: $78.12
- 50.0%: $74.79
- 61.8%: $71.47
Support: $60.71 (Swing Low), $77.78 (50-Day MA)
Resistance: $88.88 (Swing High)
Disclaimer
The content on MarketsFN.com is provided for educational and informational purposes only. It does not constitute financial advice, investment recommendations, or trading guidance. All investments involve risks, and past performance does not guarantee future results. You are solely responsible for your investment decisions and should conduct independent research and consult a qualified financial advisor before acting. MarketsFN.com and its authors are not liable for any losses or damages arising from your use of this information.