Cotton: Up 5.6% to $77.91 — Testing 38.2% Fibonacci Support
· Commodities · QuoteReporter
Cotton: Up 5.6% to $77.91 — Testing 38.2% Fibonacci Support
Analysis Date: June 08, 2026
📊 Current Market Data
CURRENT PRICE
$77.91
DAILY CHANGE
+5.64%
WEEKLY CHANGE
+1.66%
52W HIGH
$88.88
52W LOW
$60.71
💡 Key Market Factors
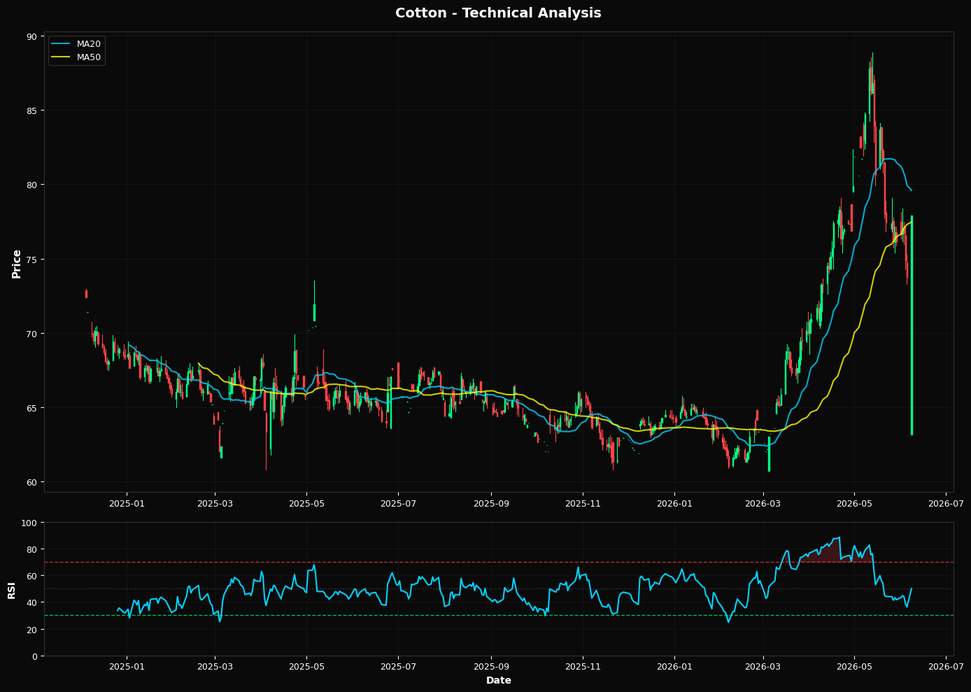
Cotton prices are poised for a potential breakout, with the most critical factor being the U.S. dollar's trajectory. As cotton is priced in dollars, any significant movement in the USD can directly impact its price. Currently, the dollar's strength or weakness is the most immediate macro driver for cotton. If the Federal Reserve signals a pause or slowdown in rate hikes, this could weaken the dollar, making cotton cheaper for foreign buyers and potentially driving prices higher. Given the current price of $77.91, a weaker dollar could push cotton above its nearest Fibonacci support at $78.12, signaling further bullish momentum. From a technical perspective, cotton is at a critical juncture. The Relative Strength Index (RSI) at 49.9 suggests that the market is neither overbought nor oversold, indicating potential for movement in either direction. However, the price is currently above the 50-day moving average (MA50) of $77.46 but below the 20-day moving average (MA20) of $79.59. This positioning suggests a short-term consolidation phase, with the potential for an upward breakout if the price can sustain above the MA50 and challenge the MA20. The 200-day moving average (MA200) at $67.40 provides a strong long-term support, reinforcing the bullish bias if the price remains above this level. A key risk or catalyst that could alter the current outlook is the upcoming U.S. inflation data release. A higher-than-expected inflation figure could prompt the Federal Reserve to maintain or even increase its hawkish stance, strengthening the dollar and potentially putting downward pressure on cotton prices. Conversely, a lower inflation reading could weaken the dollar, providing a tailwind for cotton prices to rise further. This data point is crucial as it will directly influence Fed policy expectations and, by extension, the USD's strength. The market may be underpricing the potential impact of geopolitical tensions on global trade flows, which could disrupt cotton supply chains and affect prices. If tensions escalate, leading to trade restrictions or increased tariffs, this could reduce supply and push prices higher. The upcoming U.S. inflation data will be pivotal in confirming or invalidating the current bullish view. A dovish Fed response to lower inflation could catalyze a significant upward move in cotton prices, potentially challenging the 52-week high of $88.88.📈 Technical Indicators Summary
RSI (14)
49.9
50-Day MA
$77.46
200-Day MA
$67.40
Fib Level
38.2%
📊 Technical Analysis Chart (18-Month View)
📐 Fibonacci Retracement Analysis
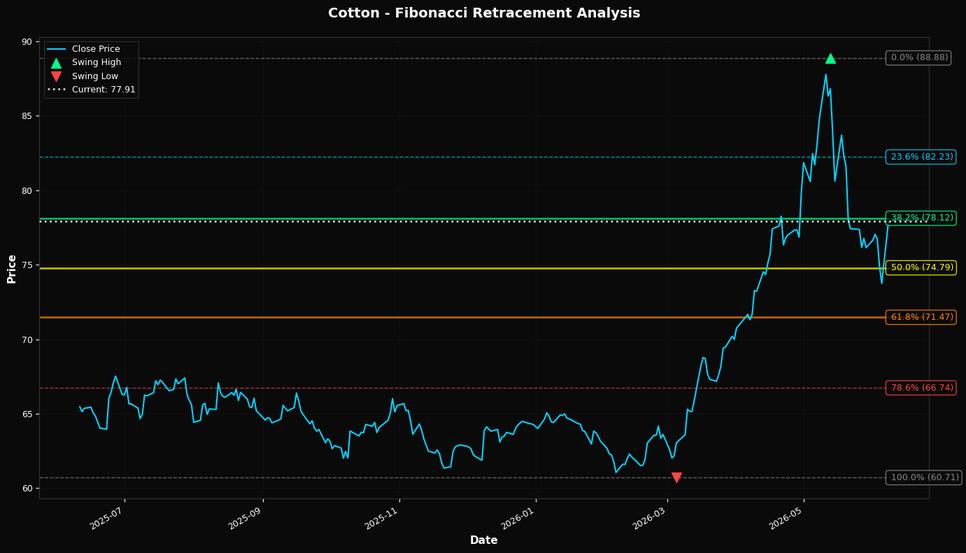
🎯 Key Trading Levels
Key Fibonacci Levels:
- 38.2%: $78.12
- 50.0%: $74.79
- 61.8%: $71.47
Support: $60.71 (Swing Low), $77.46 (50-Day MA)
Resistance: $88.88 (Swing High)
Disclaimer
The content on MarketsFN.com is provided for educational and informational purposes only. It does not constitute financial advice, investment recommendations, or trading guidance. All investments involve risks, and past performance does not guarantee future results. You are solely responsible for your investment decisions and should conduct independent research and consult a qualified financial advisor before acting. MarketsFN.com and its authors are not liable for any losses or damages arising from your use of this information.