Cotton: Up 6.4% to $76.71 — Testing 38.2% Fibonacci Support
· Commodities · QuoteReporter
Cotton: Up 6.4% to $76.71 — Testing 38.2% Fibonacci Support
Analysis Date: June 25, 2026
📊 Current Market Data
CURRENT PRICE
$76.71
DAILY CHANGE
+6.41%
WEEKLY CHANGE
-0.25%
52W HIGH
$88.88
52W LOW
$60.71
💡 Key Market Factors
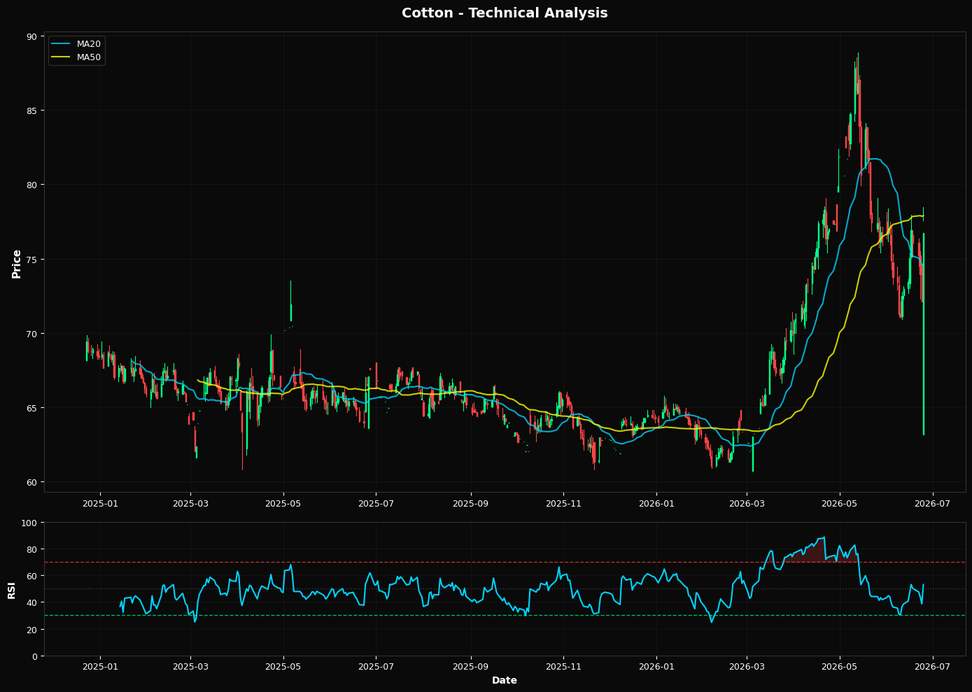
Cotton prices are poised for a potential breakout, driven by a confluence of technical indicators and macroeconomic factors. The most pressing macro driver for cotton today is the U.S. dollar's strength, which has been a significant headwind for commodities priced in USD. However, with the Federal Reserve signaling a potential pause in rate hikes, the dollar could weaken, providing a tailwind for cotton prices. This shift could amplify the recent daily gain of +6.41%, suggesting that the market may be underpricing the impact of a softer dollar on cotton demand globally. From a technical perspective, cotton is at a critical juncture. The current price of $76.71 is above the 20-day moving average of $74.63 but below the 50-day moving average of $77.89, indicating a potential bullish crossover if momentum continues. The RSI at 53.0 suggests neutral momentum, but the proximity to the 38.2% Fibonacci support level at $78.12 could act as a springboard for further gains. The 200-day moving average at $67.90 provides a solid long-term support, reinforcing the bullish bias. If cotton can decisively break above the 50-day moving average, it could signal a sustained upward trend. A key risk to this bullish outlook is the upcoming U.S. inflation data release. A higher-than-expected inflation print could reignite fears of further Fed tightening, strengthening the dollar and potentially reversing cotton's recent gains. Conversely, a softer inflation reading could validate the current bullish setup by weakening the dollar and boosting commodity prices. The market may be underestimating the potential for inflation data to swing sentiment and impact cotton's trajectory. Looking ahead, the next U.S. inflation report will be crucial in confirming or invalidating this bullish view. A dovish inflation print could catalyze a breakout above the $78.12 Fibonacci level, setting the stage for a test of the 52-week high at $88.88. Conversely, a hawkish surprise could reinforce dollar strength, pressuring cotton prices back towards the 20-day moving average. Investors should closely monitor this data point, as it will likely dictate the near-term direction for cotton.📈 Technical Indicators Summary
RSI (14)
53.0
50-Day MA
$77.89
200-Day MA
$67.90
Fib Level
38.2%
📊 Technical Analysis Chart (18-Month View)
📐 Fibonacci Retracement Analysis
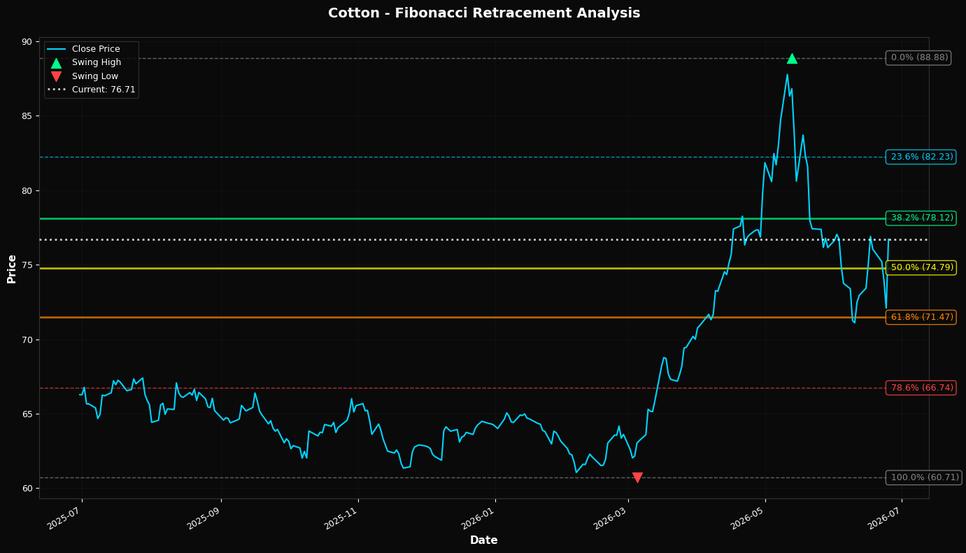
🎯 Key Trading Levels
Key Fibonacci Levels:
- 38.2%: $78.12
- 50.0%: $74.79
- 61.8%: $71.47
Support: $60.71 (Swing Low), $77.89 (50-Day MA)
Resistance: $88.88 (Swing High)
Disclaimer
The content on MarketsFN.com is provided for educational and informational purposes only. It does not constitute financial advice, investment recommendations, or trading guidance. All investments involve risks, and past performance does not guarantee future results. You are solely responsible for your investment decisions and should conduct independent research and consult a qualified financial advisor before acting. MarketsFN.com and its authors are not liable for any losses or damages arising from your use of this information.