Crypto Market Sees Gains: BNB, Tron, and Bitcoin Lead the Rally
· Crypto · QuoteReporter
Crypto Market Sees Gains: BNB, Tron, and Bitcoin Lead the Rally
Crypto Market Report | July 30, 2026
📊 Crypto Market Overview
The cryptocurrency market is currently displaying a neutral overall sentiment, with most major assets experiencing minor price fluctuations. Bitcoin is trading at $64,207.5781, having risen by 0.47% over the past 24 hours, while Ethereum has seen a more subdued increase of 0.20% to $1,912.3700. Other key players such as Ripple, Solana, and BNB have also recorded modest changes, with XRP up 0.44% to $1.0776, SOL marginally down to $73.6500, and BNB gaining 0.87% to $576.3700.
From a technical perspective, the Relative Strength Index (RSI) values for the major cryptocurrencies are generally hovering around the mid-point, indicating a lack of strong directional momentum. Bitcoin's RSI stands at 52.4, while Ethereum's is slightly higher at 56.3. The Moving Average Convergence Divergence (MACD) indicator is positive for Bitcoin and Ethereum, suggesting a potential for continued upward movement, although the signals are not particularly strong.
The macroeconomic context is influencing the crypto market, with news of Bitcoin ETF inflows returning, while Ether funds have slipped into outflows. Regulatory developments are also ongoing, with South Korea proposing stablecoin rules ahead of a comprehensive crypto law. The US has imposed sanctions on an Iranian maritime firm for accepting Bitcoin to evade restrictions, highlighting the ongoing scrutiny of cryptocurrency use in illicit activities. Meanwhile, industry developments continue, with Binance.US announcing plans to enter the prediction markets space and Japanese game developer launching a Bitcoin and altcoin fund. Overall, the market is responding to a mix of technical, regulatory, and industry-specific factors, with a generally cautious tone prevailing.
From a technical perspective, the Relative Strength Index (RSI) values for the major cryptocurrencies are generally hovering around the mid-point, indicating a lack of strong directional momentum. Bitcoin's RSI stands at 52.4, while Ethereum's is slightly higher at 56.3. The Moving Average Convergence Divergence (MACD) indicator is positive for Bitcoin and Ethereum, suggesting a potential for continued upward movement, although the signals are not particularly strong.
The macroeconomic context is influencing the crypto market, with news of Bitcoin ETF inflows returning, while Ether funds have slipped into outflows. Regulatory developments are also ongoing, with South Korea proposing stablecoin rules ahead of a comprehensive crypto law. The US has imposed sanctions on an Iranian maritime firm for accepting Bitcoin to evade restrictions, highlighting the ongoing scrutiny of cryptocurrency use in illicit activities. Meanwhile, industry developments continue, with Binance.US announcing plans to enter the prediction markets space and Japanese game developer launching a Bitcoin and altcoin fund. Overall, the market is responding to a mix of technical, regulatory, and industry-specific factors, with a generally cautious tone prevailing.
📰 Crypto News
- Chinese newspaper warns of Bitcoin extortion scam using its name
- Bitcoin ETF inflows return as Ether funds slip into outflows
- South Korea report proposes stablecoin rules before crypto law
- US sanctions Iranian maritime firm, says it accepted Bitcoin to evade restrictions
- Luno cuts 20% of staff as crypto layoffs spread across 12 firms in July
- Japanese game developer launches Bitcoin, altcoin fund with SBI
- Ethereum Foundation adds SEAL 911 co-founder to board as privacy focus grows
- US arbitration giant launches specialist panel for crypto disputes
- Robinhood posts record quarter as crypto revenue slides 38%
- Binance.US to attempt prediction markets entry as CFTC-licensed entity, says CEO
- Crypto entering biggest consolidation phase in history, says ARK analyst
- Bitcoin, ether whipsaw wipes out $286 million in leveraged bets
- Bitcoin analysts agree the Fed's hold was hawkish. They are split on what happens next.
- Ether, XRP flat as chip stocks steady on Samsung's 250-fold profit surge
- Bitcoin's quantum plan assumes some algorithms break. AI just weakened one in 60 hours
🔍 Technical Analysis
Bitcoin (BTC) — +0.47%
$64,207.58 52W: $57,747.77 — $97,860.60
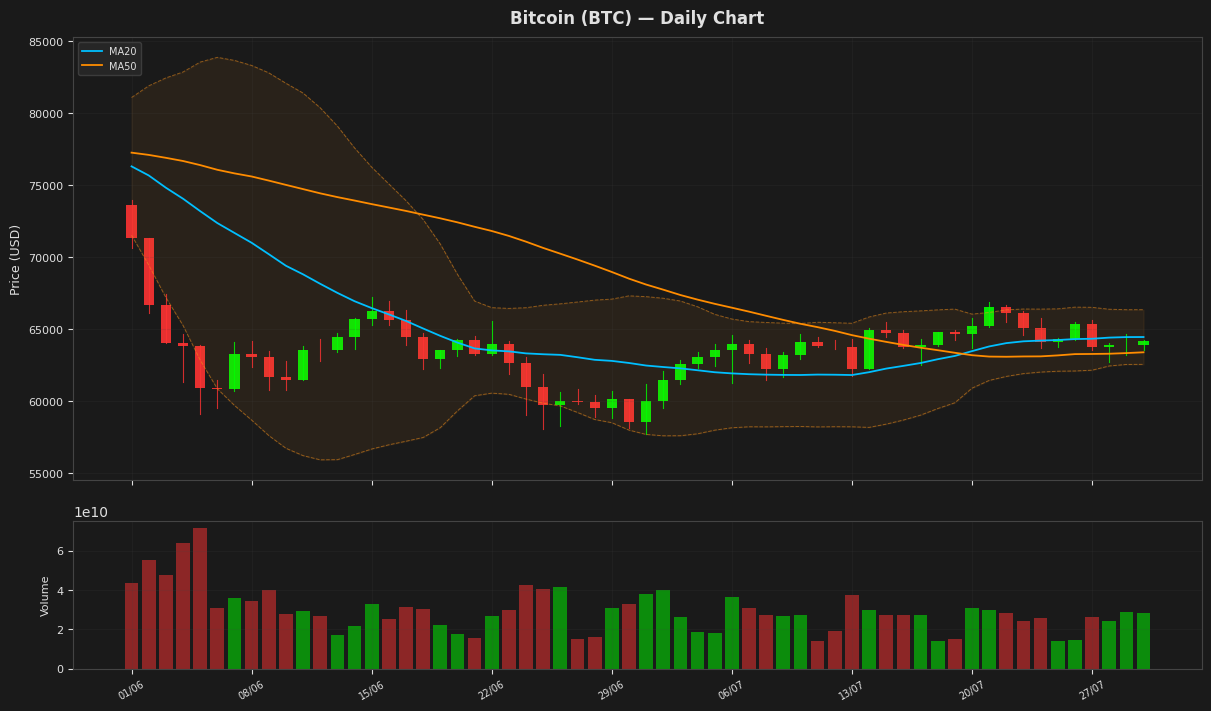
Bitcoin is currently trading at $64,207, slightly above its 20-day and 50-day moving averages of $64,449 and $63,390, respectively, indicating a relatively stable trend. The RSI of 52.41 suggests a neutral market sentiment, while the MACD being below its signal line indicates a potential bearish signal. The price is also within the Bollinger Bands, with the upper band at $66,346 and lower band at $62,553. The ATR of 1,406 indicates moderate volatility.
Ethereum (ETH) — +0.20%
$1,912.37 52W: $1,506.51 — $3,446.62
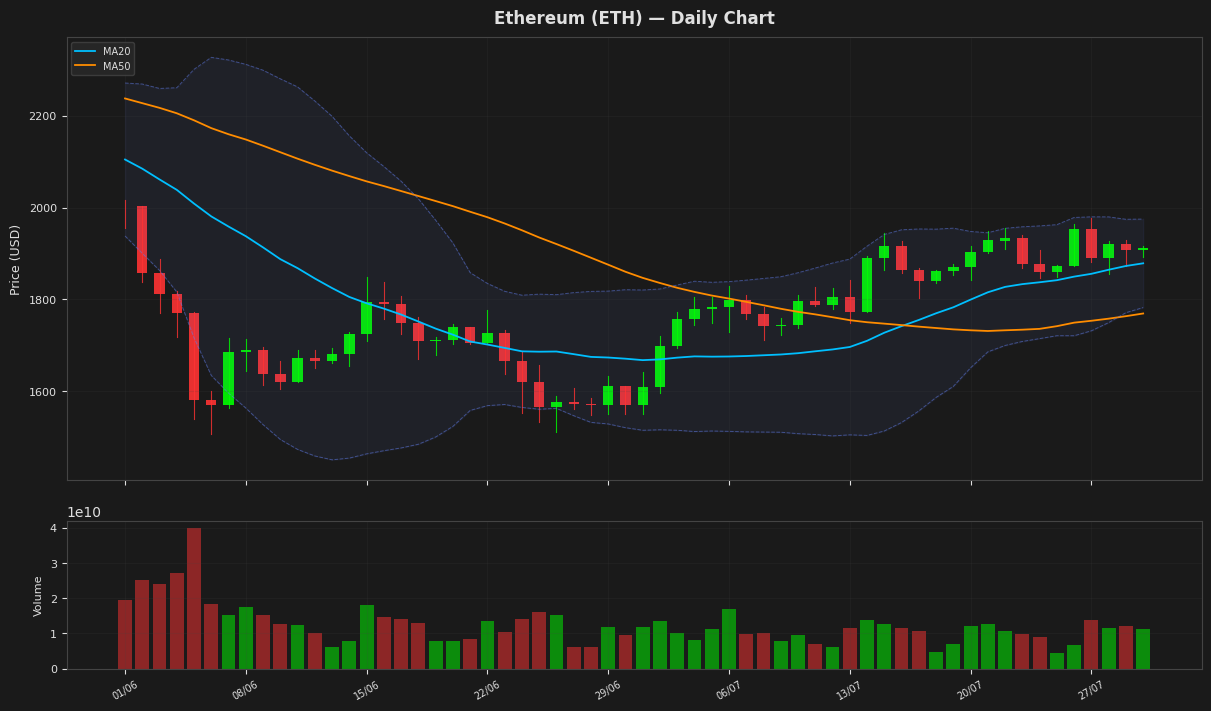
Ethereum is currently trading at $1,912.37, slightly above its 20-day moving average of $1,878.59, indicating a positive short-term trend. The Relative Strength Index (RSI) at 56.33 suggests a neutral to slightly bullish momentum, while the MACD line being below its signal line indicates a potential weakening in the upward momentum. The price is also near the upper Bollinger Band at $1,974.96, suggesting a potential resistance level.
Ripple (XRP) — +0.44%
$1.0776 52W: $1.0098 — $2.4103
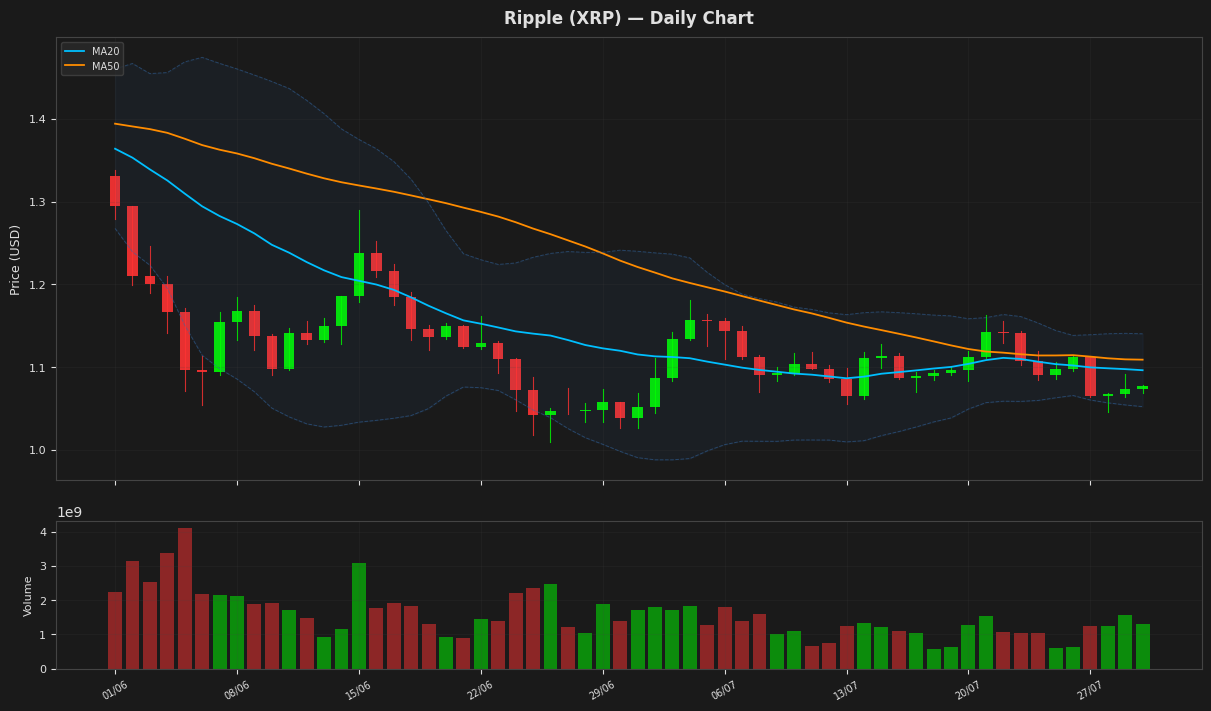
Ripple's price is currently at $1.077600, showing a slight increase, and is positioned between the upper and lower Bollinger Bands, indicating a relatively stable trend. The RSI is near the neutral zone, suggesting a lack of strong momentum in either direction. The MACD is below the signal line, indicating a potential bearish signal. The price is also below both the MA20 and MA50, further indicating a bearish trend.
Solana (SOL) — +0.07%
$73.6500 52W: $60.4147 — $148.2160
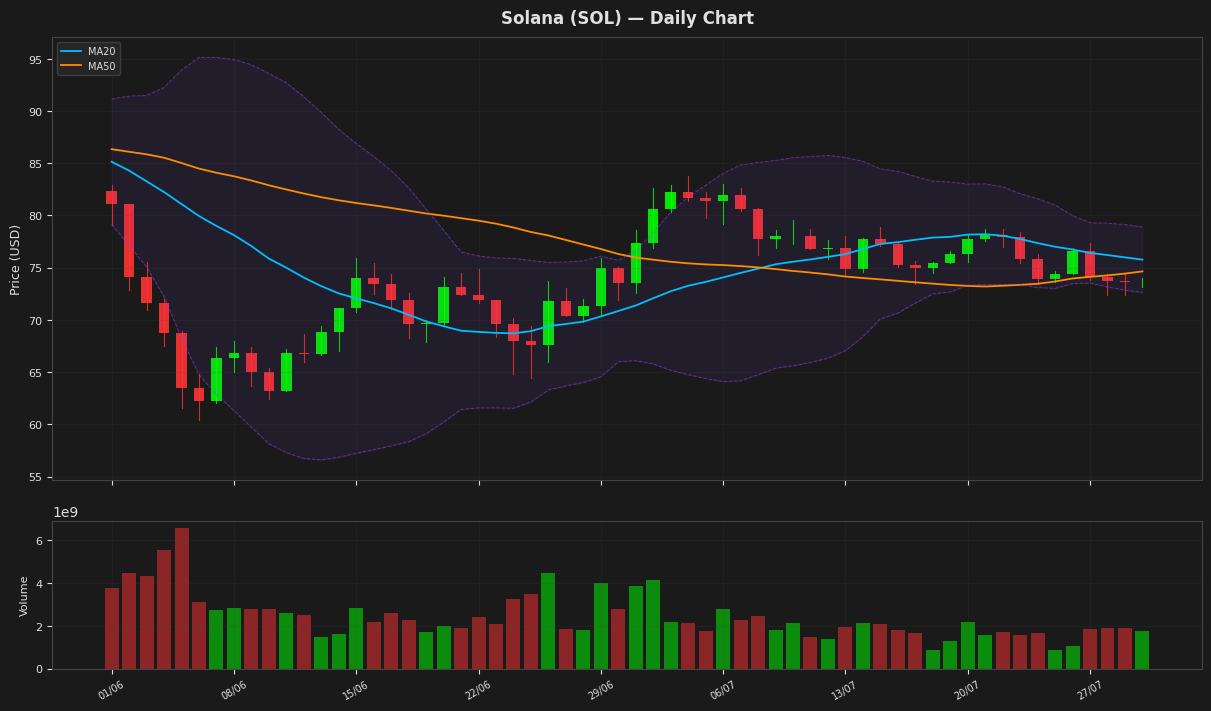
Solana's current price is $73.65, slightly below its MA20 and MA50, indicating a lack of strong directional momentum. The RSI is near 44, suggesting a neutral to slightly oversold condition, while the MACD is below its signal line, indicating a bearish signal. The price is currently between the Bollinger Bands, with the upper and lower bands at $78.91 and $72.62 respectively, indicating a relatively stable trading range.
BNB (BNB) — +0.87%
$576.3700 52W: $538.5992 — $954.8583
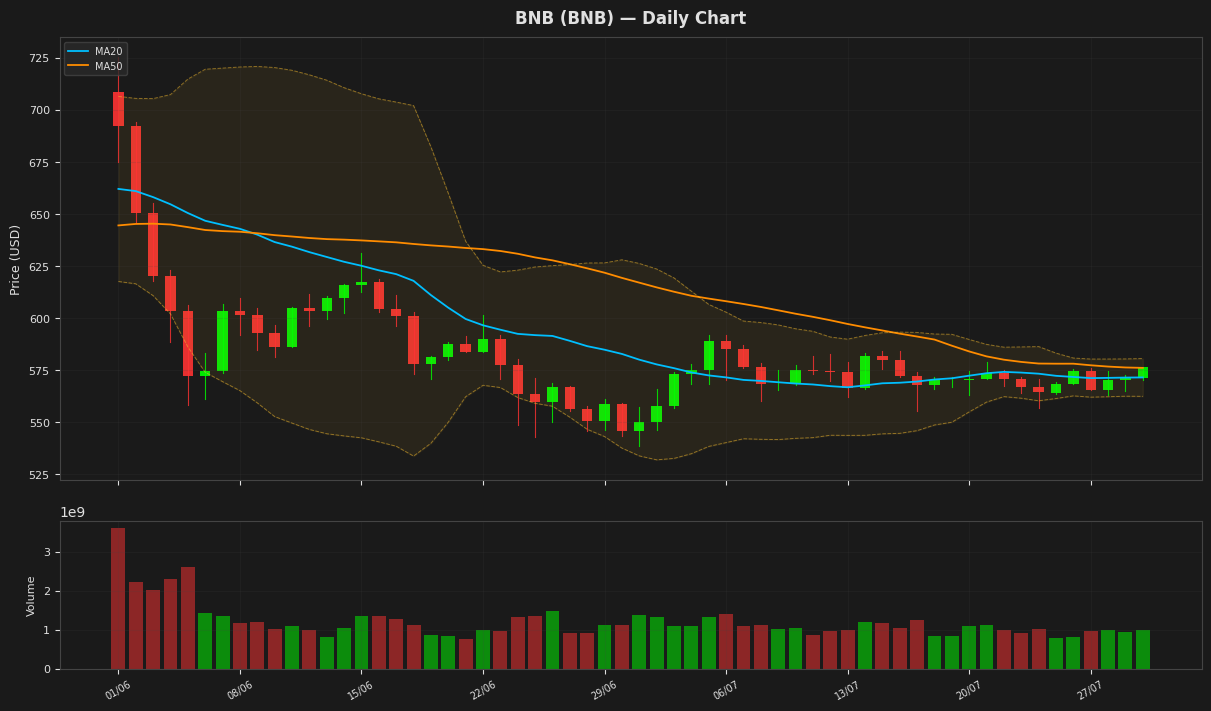
BNB is currently trading at $576.37, slightly above its MA50 and near the upper Bollinger Band at $580.64, indicating a potential resistance level. The RSI is at 54.25, suggesting a neutral market sentiment. The MACD is below its signal line, indicating a potential bearish signal, while the ATR suggests moderate volatility. The price is still below its 52-week high, indicating a significant downtrend from its peak.
Tron (TRX) — +0.67%
$0.327506 52W: $0.268138 — $0.376332
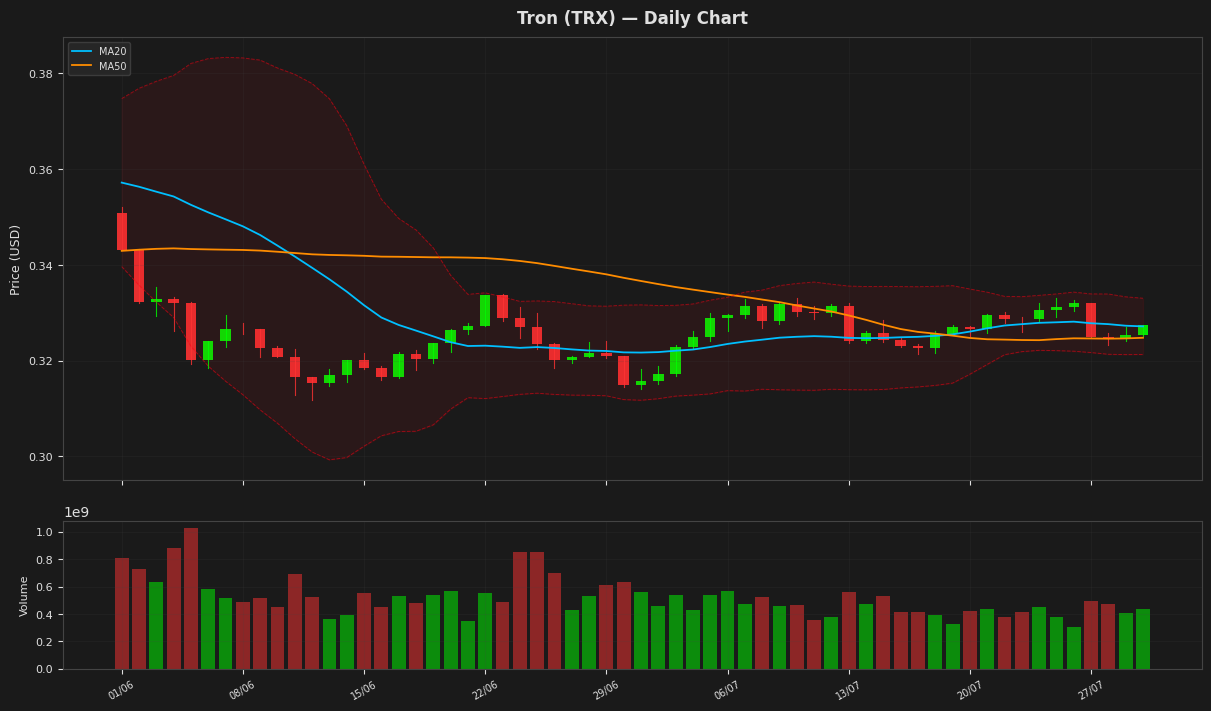
Tron's price is currently at $0.327506, showing a slight increase of 0.67% and trading near the middle of the Bollinger Bands. The RSI is at 59.75, indicating a neutral to slightly bullish sentiment, while the MACD is below its signal line, suggesting a potential slowdown in the upward momentum. The Average True Range is relatively low at 0.003247, indicating stable price movements.
Dogecoin (DOGE) — -0.08%
$0.070020 52W: $0.068293 — $0.156602
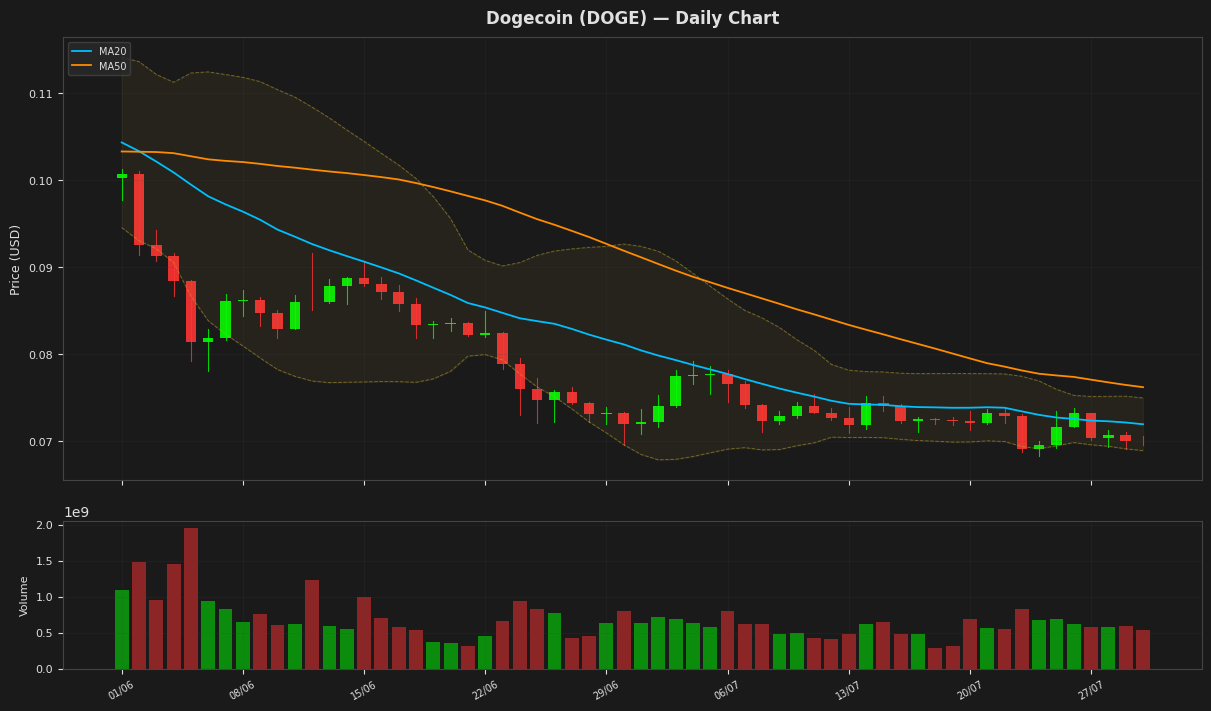
Dogecoin's price is currently at $0.070020, showing a slight decline, and is positioned near the lower Bollinger Band at $0.068926, indicating potential oversold conditions. The RSI(14) value of 41.773573 is below the neutral zone, suggesting bearish momentum. The MACD is negative and below its signal line, confirming the bearish trend. The price is also below both MA20 and MA50, further indicating a downtrend.
Disclaimer
The content on MarketsFN.com is provided for educational and informational purposes only. It does not constitute financial advice or investment recommendations. All investments involve risk. Past performance does not guarantee future results.