Crypto Market Sees Gains: Dogecoin, Tron, and Ethereum Lead the Charge
· Crypto · QuoteReporter
Crypto Market Sees Gains: Dogecoin, Tron, and Ethereum Lead the Charge
Crypto Market Report | July 24, 2026
📊 Crypto Market Overview
The cryptocurrency market is currently displaying a mixed sentiment, with most major assets experiencing minor fluctuations. Bitcoin is trading at $65,343, having risen by 0.46% over the past 24 hours, while its RSI stands at 55.8, indicating a relatively neutral position. The MACD is positive at 581.9507, suggesting a continued bullish trend. Ethereum is also in the green, up 0.63% to $1,888.99, with an RSI of 60.7 and a positive MACD of 44.1719.
Other notable assets are showing varied performance. Solana is down 0.12% to $75.77, with an RSI of 42.0 and a slightly positive MACD, indicating a potential for recovery. In contrast, Dogecoin has risen by 1.07% to $0.0699, despite having an RSI of 34.5, which suggests it is oversold.
The macro context is influenced by recent news, including the EU's decision to widen its Belarus ownership ban to all crypto service providers and the fact that Bitcoin ETFs experienced outflows of $225 million, snapping a seven-day inflow streak. Additionally, the delisting of 65 trading pairs by BitMEX amid its exchange shutdown has contributed to the market's cautious atmosphere.
From a technical standpoint, several assets are displaying interesting signals. Bitcoin's RSI and MACD suggest a stable trend, while Ethereum's indicators point to continued strength. Conversely, Solana and Dogecoin's RSI values indicate potential for a bounce, given their oversold conditions. Overall, the market is currently characterized by a mix of stability and caution, with investors likely waiting for clearer signals before making significant moves. The recent news and technical indicators are likely to continue influencing market sentiment in the near term.
Other notable assets are showing varied performance. Solana is down 0.12% to $75.77, with an RSI of 42.0 and a slightly positive MACD, indicating a potential for recovery. In contrast, Dogecoin has risen by 1.07% to $0.0699, despite having an RSI of 34.5, which suggests it is oversold.
The macro context is influenced by recent news, including the EU's decision to widen its Belarus ownership ban to all crypto service providers and the fact that Bitcoin ETFs experienced outflows of $225 million, snapping a seven-day inflow streak. Additionally, the delisting of 65 trading pairs by BitMEX amid its exchange shutdown has contributed to the market's cautious atmosphere.
From a technical standpoint, several assets are displaying interesting signals. Bitcoin's RSI and MACD suggest a stable trend, while Ethereum's indicators point to continued strength. Conversely, Solana and Dogecoin's RSI values indicate potential for a bounce, given their oversold conditions. Overall, the market is currently characterized by a mix of stability and caution, with investors likely waiting for clearer signals before making significant moves. The recent news and technical indicators are likely to continue influencing market sentiment in the near term.
📰 Crypto News
- EU widens Belarus ownership ban to all crypto service providers
- Bitcoin ETFs snap seven-day inflow streak with $225M in outflows
- Here’s what happened in crypto today
- BitMEX hit with 623 BTC lawsuit on day it announces shutdown
- Dem senator calls GOP’s CLARITY ethics proposal a ‘piece of s---’: Politico
- BitMEX delists 65 trading pairs, derivatives in July amid exchange shutdown
- SEC sets September talks on move toward 24-hour stock trading
- Gemini sent $10M in Bitcoin to Trump PAC after joint motion with CFTC
- Coinbase lets businesses accept USDC payments from AI agents
- Bitcoin slides below $65K as Iran conflict fuels $100 oil and bond-yield surge
- Live updates: Dogecoin and ether lead pullback as investors digest tech earnings
- Ripple’s RLUSD gets two boosts as transfer volume drops 25%
- Mirae plans to turn crypto exchange Korbit into something Korea hasn't seen before
- Bitcoin holds near $65,000 as $800 billion AI selloff leaves crypto largely untouched
- Black Forest Labs Unveils FLUX 3 AI: Ditches Stills for Video—And Robot Hands
🔍 Technical Analysis
Bitcoin (BTC) — +0.46%
$65,343.22 52W: $57,747.77 — $97,860.60
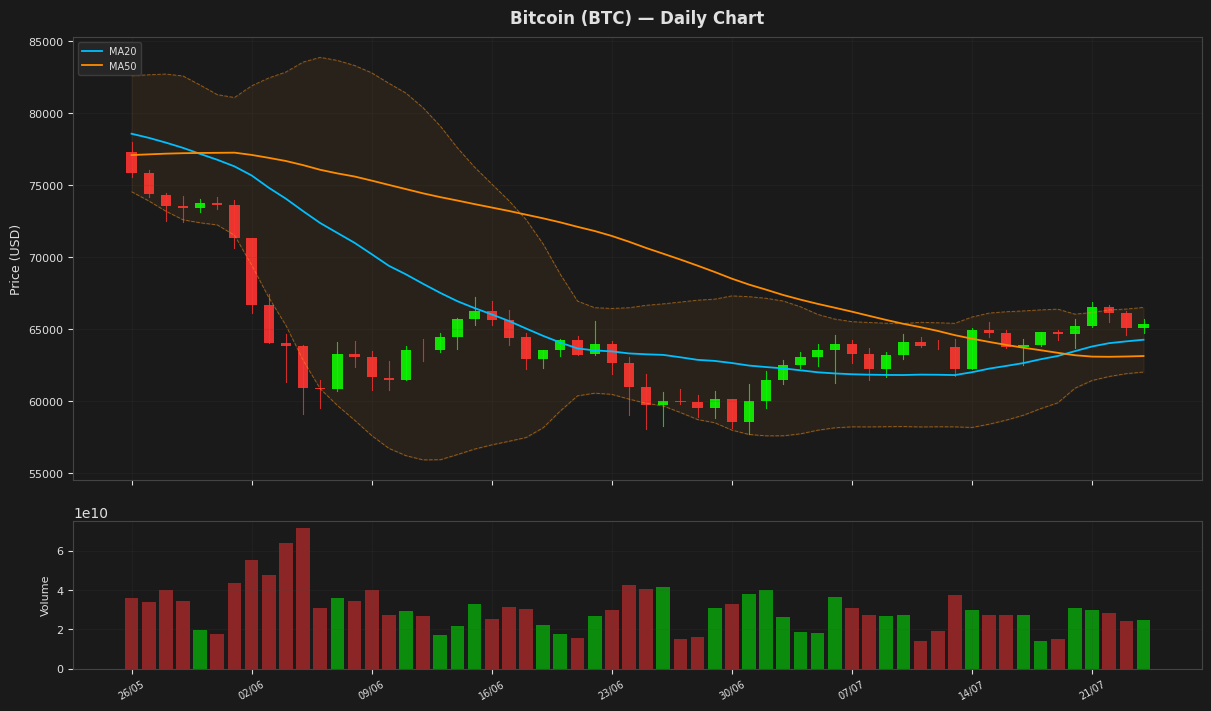
Bitcoin is trading at $65,343 with a slight increase of 0.46% in a day, staying above its MA20 and MA50 levels, indicating a bullish trend. The RSI is at 55.81, suggesting a neutral to slightly bullish momentum. The price is also within the Bollinger Bands, with the upper band at $66,506 and lower band at $62,021, indicating moderate volatility. The MACD is above its signal line, further supporting the positive momentum.
Ethereum (ETH) — +0.63%
$1,888.99 52W: $1,506.51 — $3,446.62
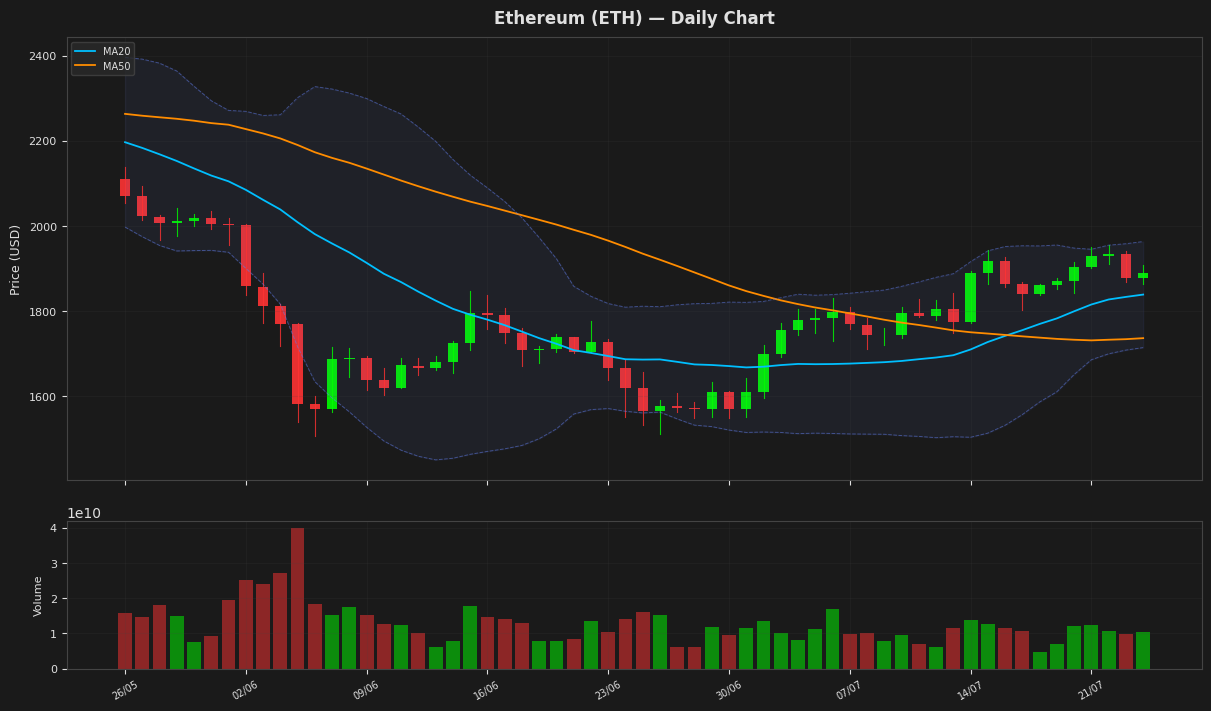
Ethereum's price is currently trading above its 20-day and 50-day moving averages, indicating a positive trend. The Relative Strength Index is at 60.66, suggesting a neutral to slightly bullish momentum. The MACD is above its signal line, further supporting the bullish sentiment. The price is also near the upper end of the Bollinger Bands, indicating potential resistance around $1963.
Ripple (XRP) — +0.57%
$1.1132 52W: $1.0098 — $2.4103
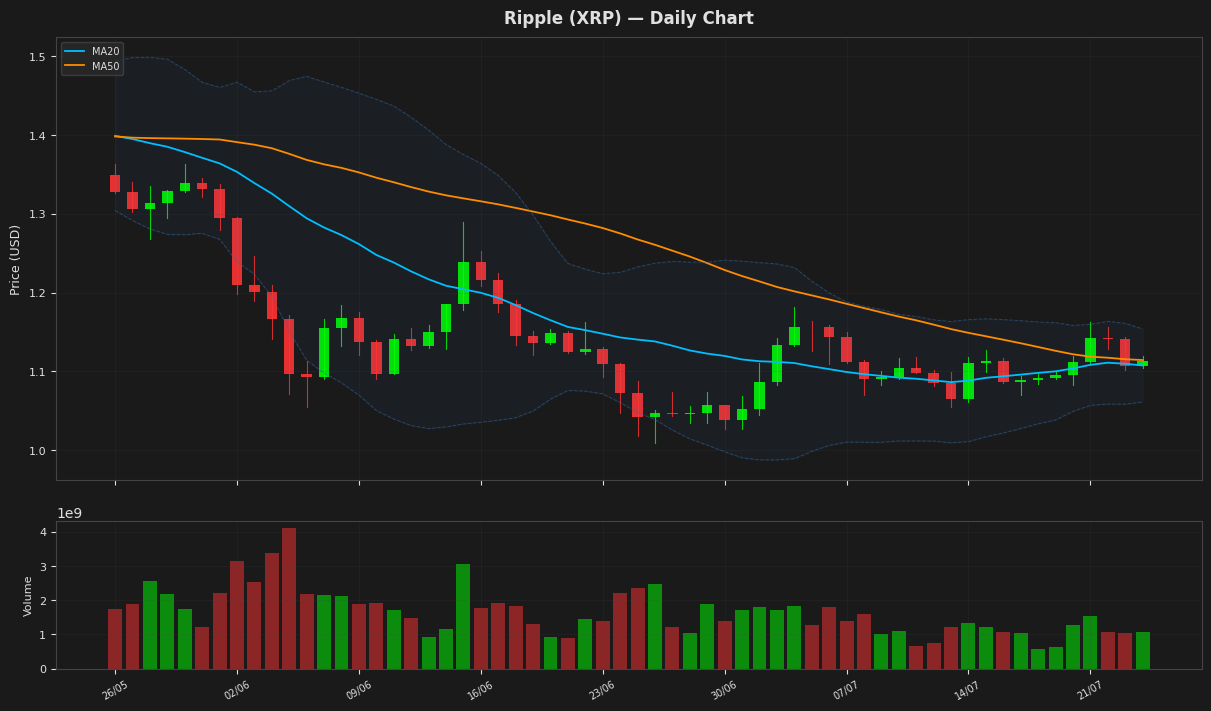
Ripple's price is currently trading near its MA20 and MA50, indicating a balance between bullish and bearish forces, with the RSI(14) at 52.205669 suggesting a neutral momentum. The Bollinger Bands indicate a relatively tight trading range, with the price near the middle of the band. The MACD is above its signal line, hinting at a potential bullish crossover. The ATR(14) suggests moderate volatility.
Solana (SOL) — -0.12%
$75.7700 52W: $60.4147 — $148.2160
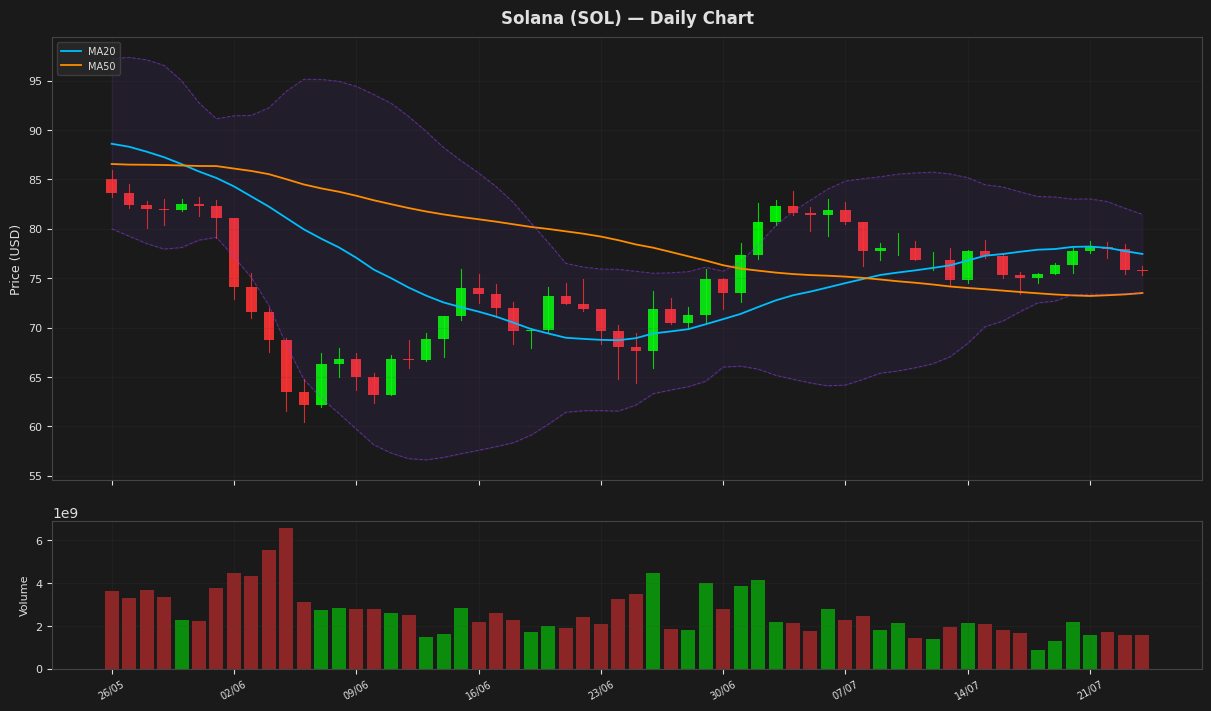
Solana's price is currently at $75.77, showing a minimal decline of 0.12%. The RSI at 42.02 indicates a neutral to slightly oversold condition, while the MACD at 0.26 is below its signal line at 0.50, suggesting a potential bearish trend continuation. The price is trading between the 20-day MA at $77.45 and the lower Bollinger Band at $73.44, indicating a possible consolidation phase.
BNB (BNB) — +0.21%
$568.1300 52W: $538.5992 — $954.8583
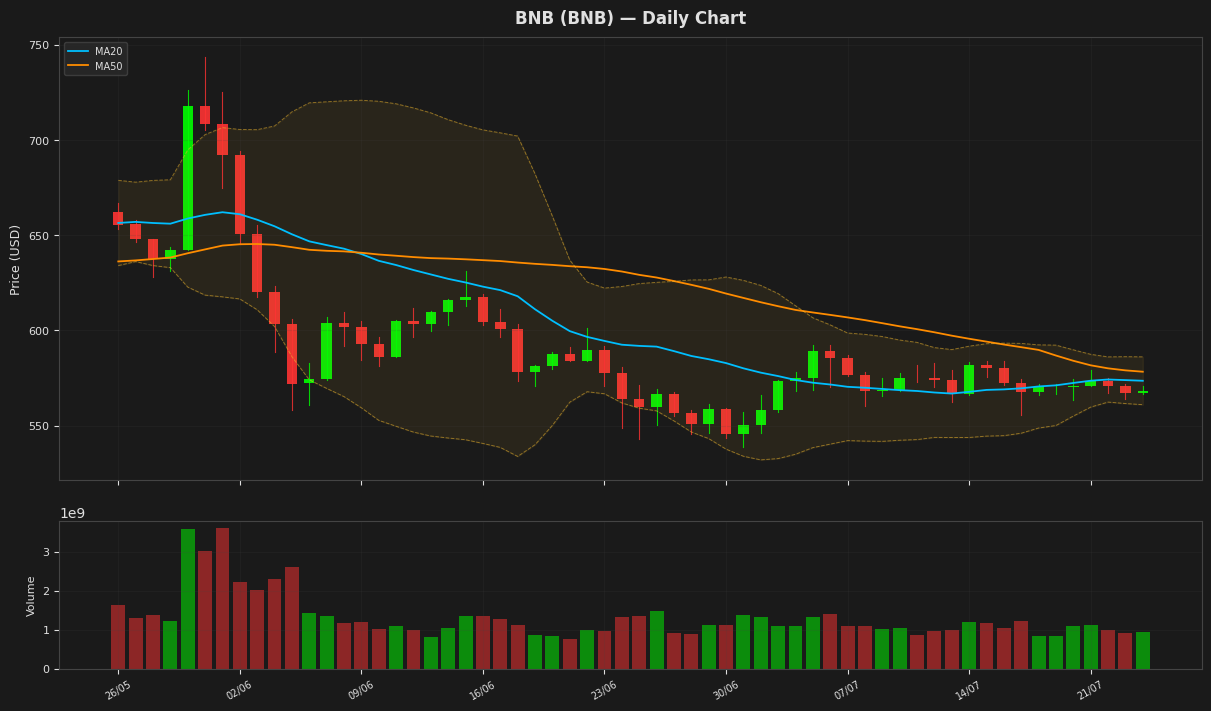
BNB is currently trading at $568.13, slightly below its MA20 and MA50, indicating a potential consolidation phase. The RSI is at 43.26, suggesting that the asset is nearing oversold territory, while the MACD is below its signal line, indicating a bearish trend. The price is hovering near the lower Bollinger Band at $561, indicating potential support.
Tron (TRX) — +0.73%
$0.331009 52W: $0.268138 — $0.376332
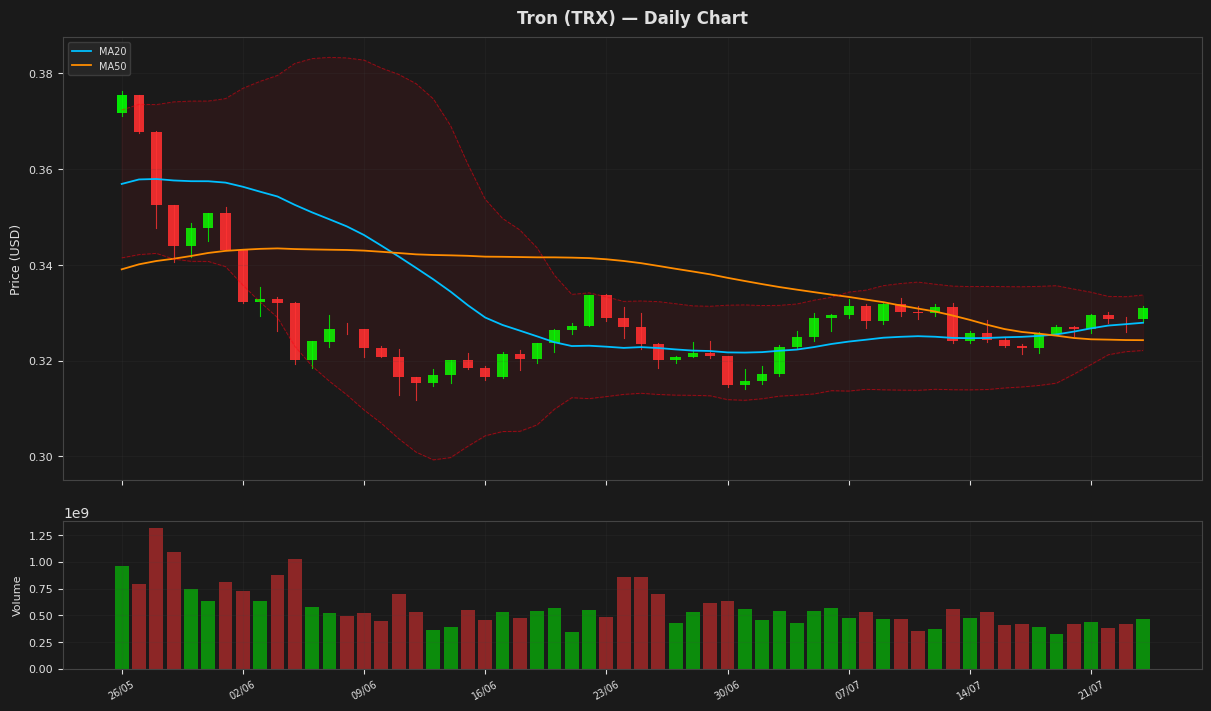
Tron's price is currently at $0.331009, showing a slight increase of 0.73% and hovering near the upper Bollinger Band at $0.333707, indicating potential resistance. The RSI is at 51.541824, suggesting a neutral market sentiment. The MACD is above its signal line, indicating a bullish signal, while the ATR remains relatively low at 0.003267, indicating stable volatility.
Dogecoin (DOGE) — +1.07%
$0.069870 52W: $0.068756 — $0.165328
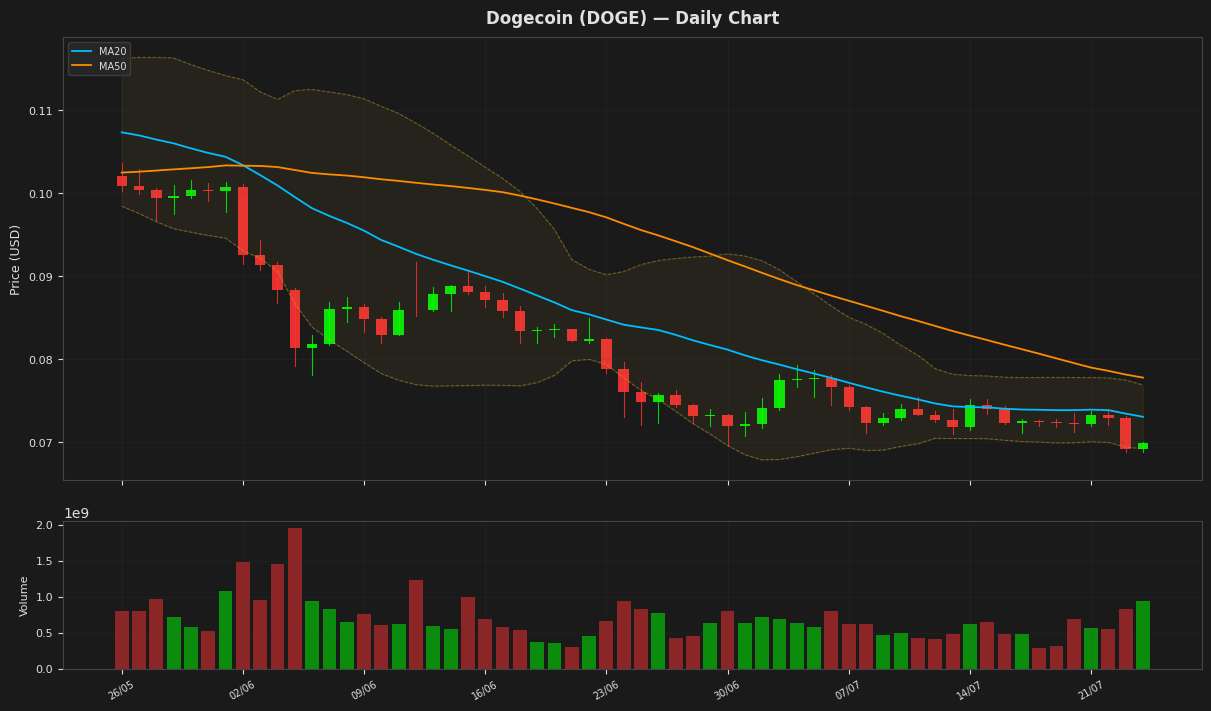
Dogecoin's price is currently trading near its 52-week low at $0.068756, with the lower Bollinger Band at $0.069216 providing support. The RSI is at 34.48, indicating oversold conditions, while the MACD is below its signal line, suggesting a bearish trend. The Average True Range is 0.002063, indicating low volatility. The short-term and long-term moving averages are above the current price, indicating a downtrend.
Disclaimer
The content on MarketsFN.com is provided for educational and informational purposes only. It does not constitute financial advice or investment recommendations. All investments involve risk. Past performance does not guarantee future results.