Crypto Market Sees Gains Led by Bitcoin, Tron, and Dogecoin Rally
· Crypto · QuoteReporter
Crypto Market Sees Gains Led by Bitcoin, Tron, and Dogecoin Rally
Crypto Market Report | July 09, 2026
📊 Crypto Market Overview
The cryptocurrency market is currently exhibiting a positive sentiment, with most major assets trading in the green. Bitcoin, the largest cryptocurrency by market capitalization, has seen a 1.16% increase today, reaching a price of $62,979.7305. Its Relative Strength Index (RSI) stands at 65.0, indicating a relatively stable position, while its MACD is negative at -630.3013. Other major cryptocurrencies such as Ethereum, Ripple, Solana, and BNB have also seen modest gains, ranging from 0.66% to 0.91%.
The macro context is influenced by various factors, including the potential impact of Artificial Intelligence on inflation and the Federal Reserve's rate decisions. The recent AI boom has raised inflation concerns, which could complicate the Fed's next rate move. Meanwhile, the crypto market is also being shaped by developments such as Russia's largest private bank, Alfa-Bank, testing crypto trading, and Crypto VC Paradigm raising $1.2 billion to invest in AI.
From a technical perspective, Ethereum's RSI is at 74.3, indicating a potentially overbought condition, while its MACD is positive at 0.4135. Solana's RSI is also relatively high at 70.3, with a positive MACD of 1.9484. In contrast, Dogecoin's RSI is at 44.5, suggesting a more neutral position. The market is also being influenced by news of a trader losing $1 million to a phishing scam, highlighting the ongoing security risks in the crypto space. Overall, the market is currently characterized by a mix of positive sentiment, technical signals, and macro influences.
The macro context is influenced by various factors, including the potential impact of Artificial Intelligence on inflation and the Federal Reserve's rate decisions. The recent AI boom has raised inflation concerns, which could complicate the Fed's next rate move. Meanwhile, the crypto market is also being shaped by developments such as Russia's largest private bank, Alfa-Bank, testing crypto trading, and Crypto VC Paradigm raising $1.2 billion to invest in AI.
From a technical perspective, Ethereum's RSI is at 74.3, indicating a potentially overbought condition, while its MACD is positive at 0.4135. Solana's RSI is also relatively high at 70.3, with a positive MACD of 1.9484. In contrast, Dogecoin's RSI is at 44.5, suggesting a more neutral position. The market is also being influenced by news of a trader losing $1 million to a phishing scam, highlighting the ongoing security risks in the crypto space. Overall, the market is currently characterized by a mix of positive sentiment, technical signals, and macro influences.
📰 Crypto News
- Russia's largest private bank Alfa-Bank tests crypto trading
- Wyden urges Senate leaders to keep dev protections in crypto bill
- Here’s what happened in crypto today
- Trader loses $1M after signing phishing token approval
- AI is shortening the shelf life of crypto security audits, researchers warn
- AI boom fuels inflation fears, complicating Fed’s next rate move
- Crypto VC Paradigm raises $1.2B to push into AI
- Mark Cuban-backed DeFi dashboard Zapper shutters after 7 years
- Crypto could benefit if Fed steps in to backstop US stock market: Analysts
- Bitcoin tumbles back to key $60K support level: What’s behind the sell pressure?
- Live markets: Bitcoin ETFs slip back to outflows while ether funds extend their streak
- Bank of Japan may speed up rate hikes, pushing borrowing costs above 2%, ex-BOJ official warns
- 'CASHCAT' trader turns $800 into over $1 million on Robinhood's brand new blockchain
- XRP holds near $1.10 as traders watch long-term breakout setup
- Bitcoin, ether steady, gold slides as U.S.-Iran tensions escalate again
🔍 Technical Analysis
Bitcoin (BTC) — +1.16%
$62,979.73 52W: $57,747.77 — $111,167.31
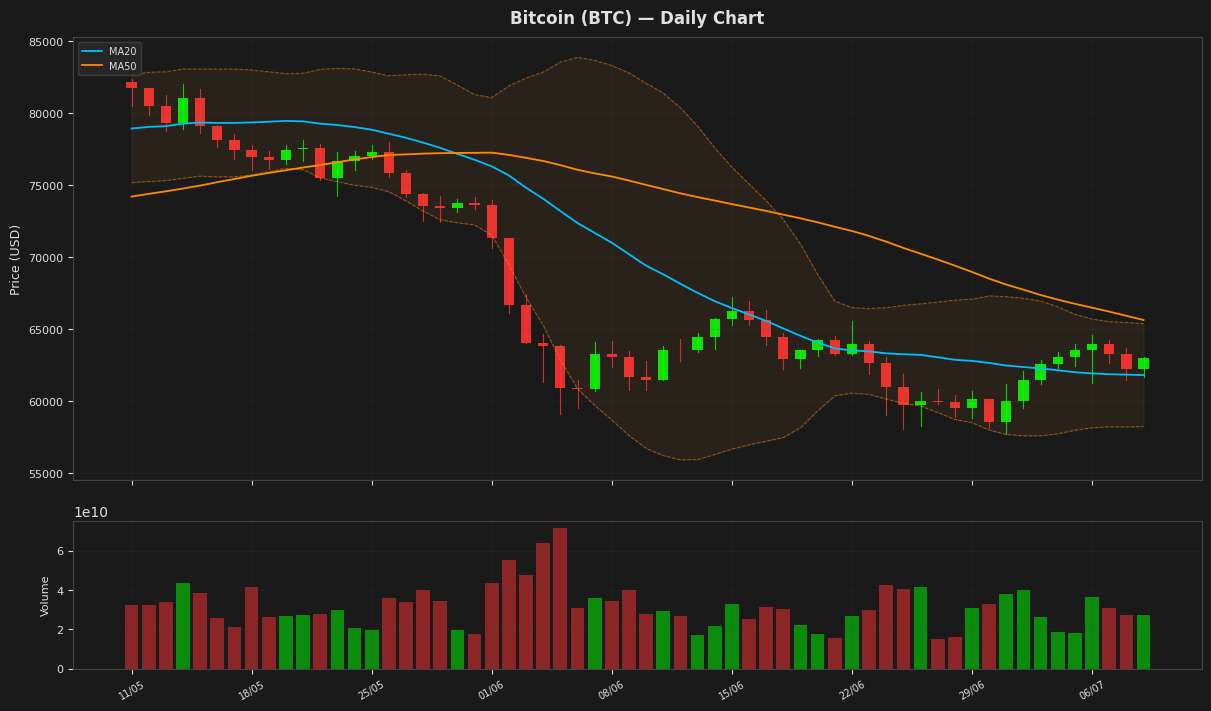
Bitcoin is currently trading at $62,979.73, slightly above its 20-day moving average of $61,809.97, indicating a potential upward trend. The Relative Strength Index (RSI) stands at 65, suggesting the asset is nearing overbought territory but still has room to maneuver. The MACD line is above its signal line, indicating a potential buy signal, although both are in negative territory.
Ethereum (ETH) — +0.81%
$1,756.80 52W: $1,506.51 — $3,914.88
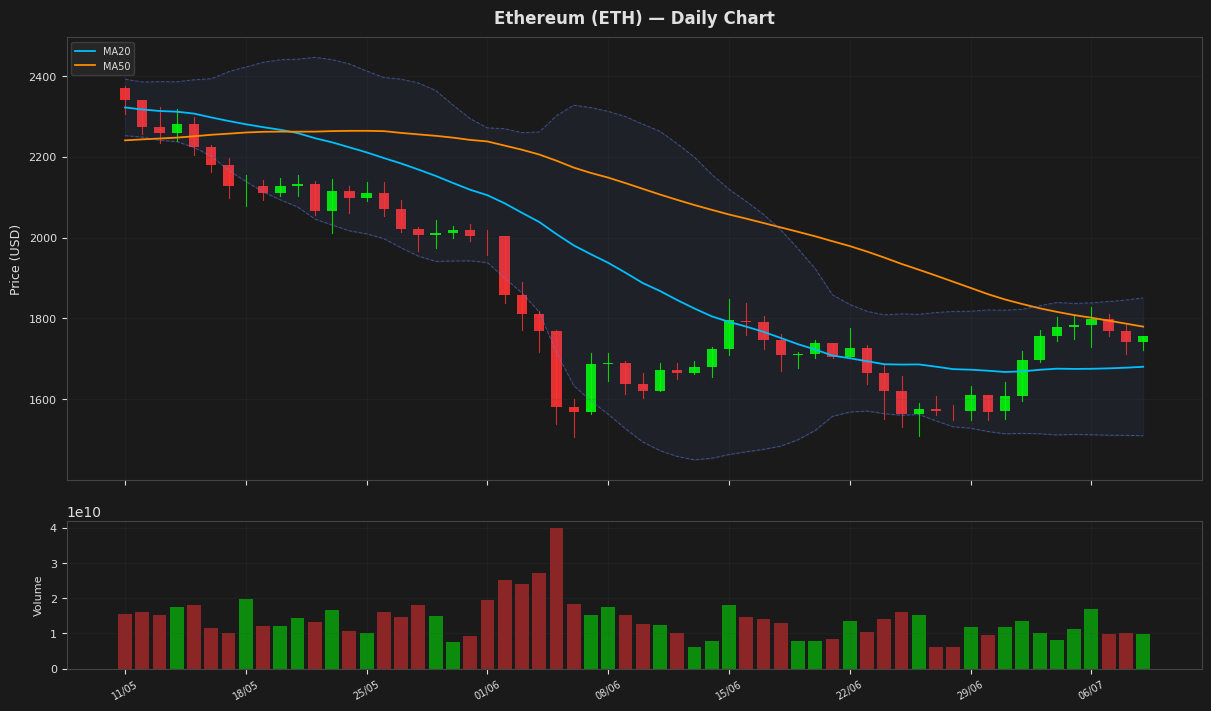
Ethereum's price is currently at $1,756.80, showing a slight increase, and is nearing the upper Bollinger Band at $1,850.97, indicating potential resistance. The RSI is at 74.27, suggesting the asset is approaching overbought territory. The MACD is positive but below its signal line, indicating a potential sell signal.
Ripple (XRP) — +0.73%
$1.0979 52W: $1.0098 — $2.5772
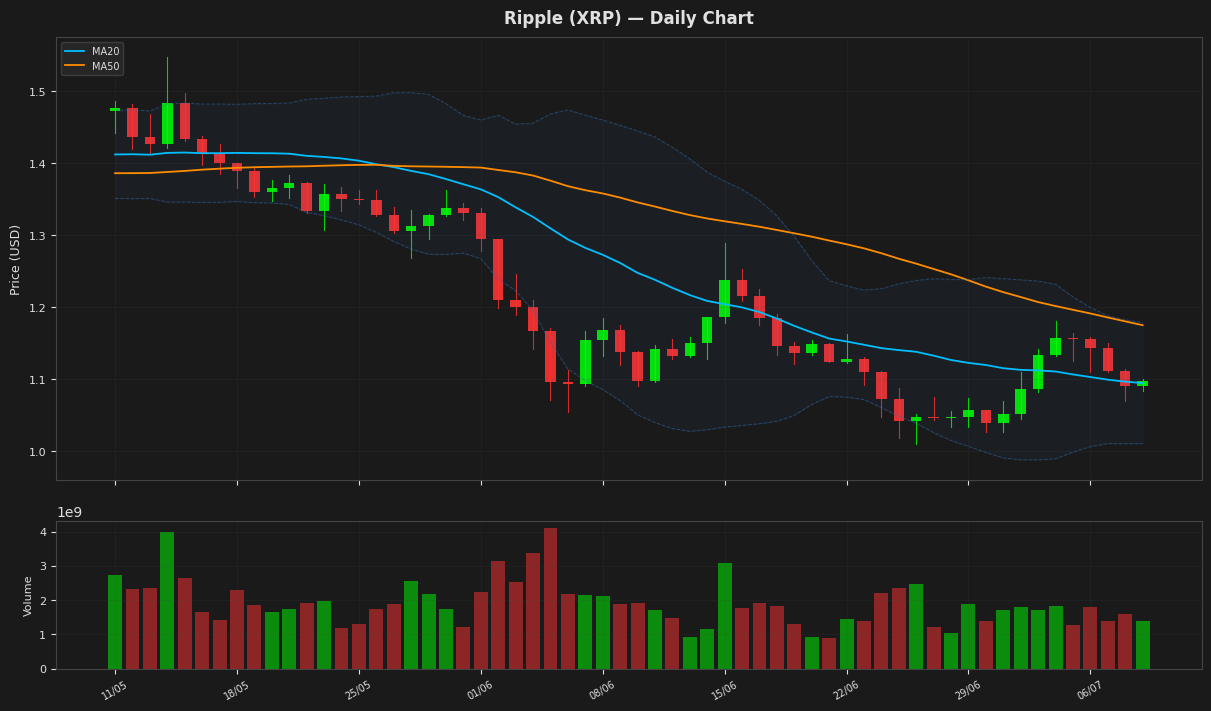
Ripple's price is currently trading near its 20-day moving average at $1.094547, with a slight bullish momentum indicated by the RSI value of 62.286243. The Bollinger Bands suggest that the price is still within a relatively narrow range, with the upper band at $1.178724 and lower band at $1.010371. The MACD line is above its signal line, indicating a potential buying signal. The ATR value of 0.040782 suggests relatively low volatility.
Solana (SOL) — +0.66%
$78.3000 52W: $60.4147 — $189.8535
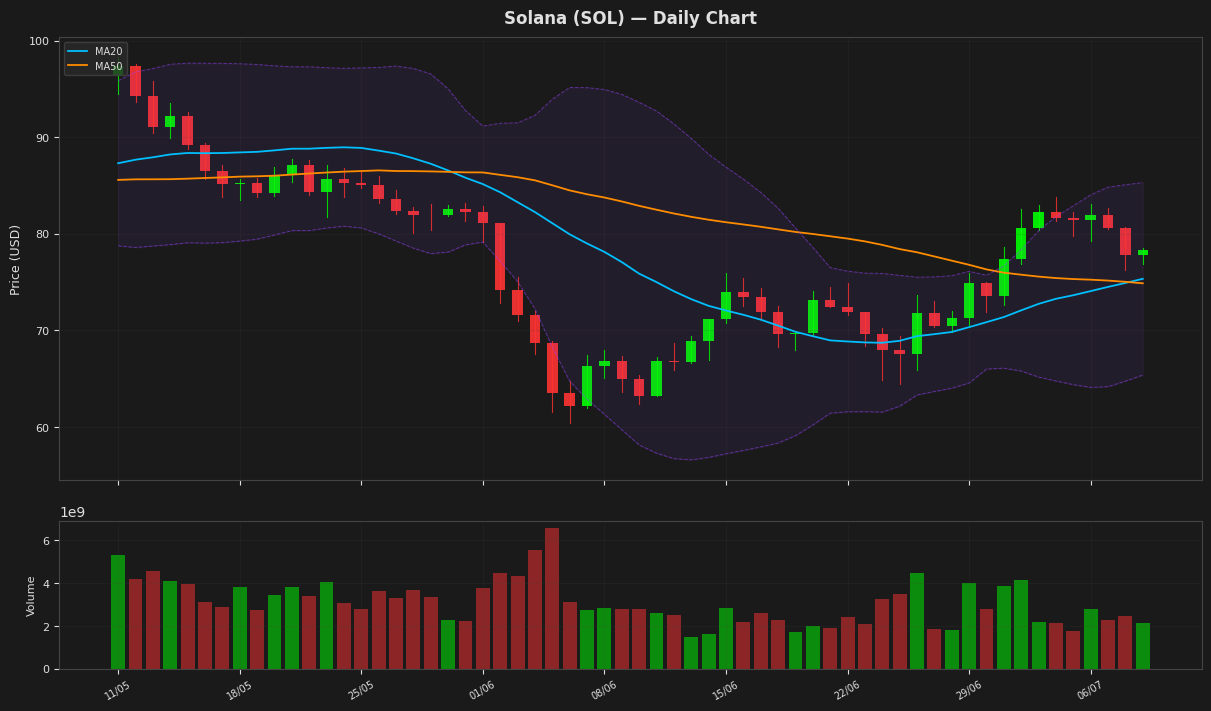
Solana's price is currently trading at $78.30, showing a slight increase of 0.66% and staying above both the MA20 and MA50, indicating a short-term uptrend. The RSI is at 70.32, nearing overbought territory, while the MACD is above its signal line, suggesting bullish momentum. The price is also within the upper half of the Bollinger Bands, with the upper band at $85.30.
BNB (BNB) — +0.74%
$572.4900 52W: $538.5992 — $1,104.25
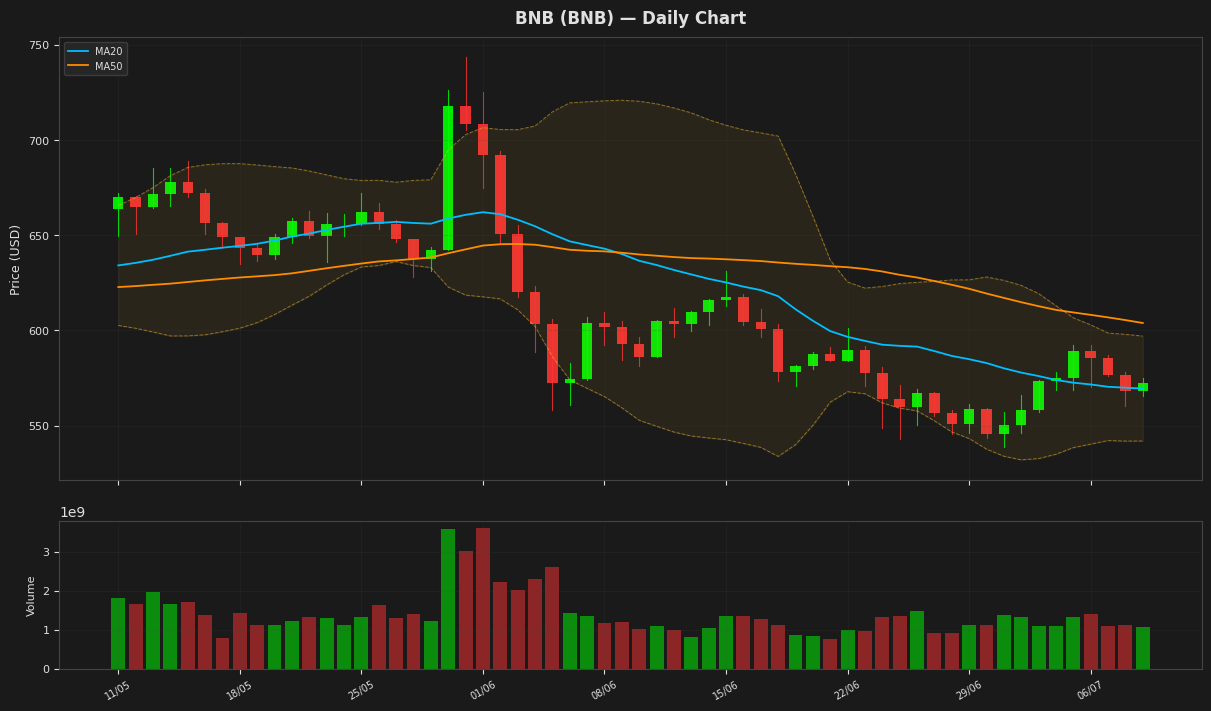
BNB is currently trading at $572.49, slightly above its 20-day moving average of $569.46, indicating a potential bullish trend. The Relative Strength Index (RSI) at 55.65 suggests a neutral to slightly bullish momentum. The price is also within the Bollinger Bands, with the upper band at $597.02 and lower band at $541.91, indicating moderate volatility. The MACD is negative but showing a potential bullish crossover.
Tron (TRX) — +0.91%
$0.331214 52W: $0.268138 — $0.376332
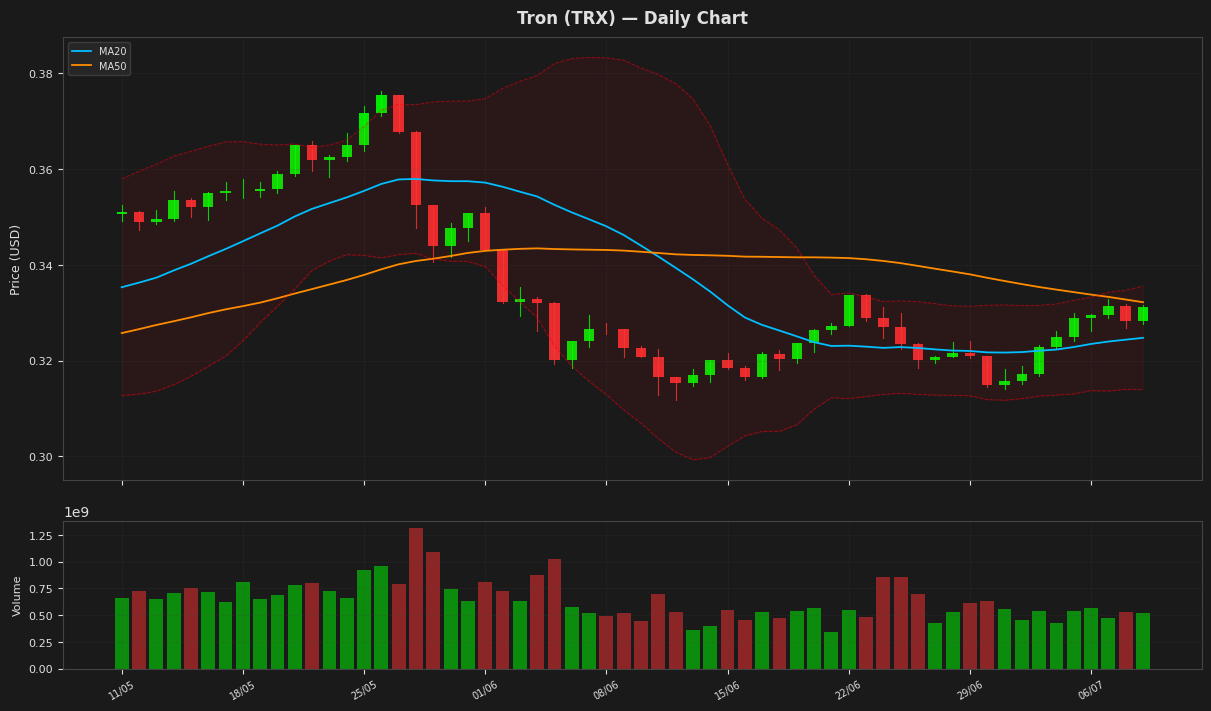
Tron's price is currently at $0.331214, showing a slight increase of 0.91% and trading near the upper Bollinger Band at 0.335536, indicating potential resistance. The RSI is at 61.398438, suggesting a moderately bullish sentiment without being overbought. The MACD is above its signal line, indicating a potential buy signal, although the crossover is not significant. The ATR indicates low volatility.
Dogecoin (DOGE) — +0.90%
$0.072960 52W: $0.069611 — $0.188677
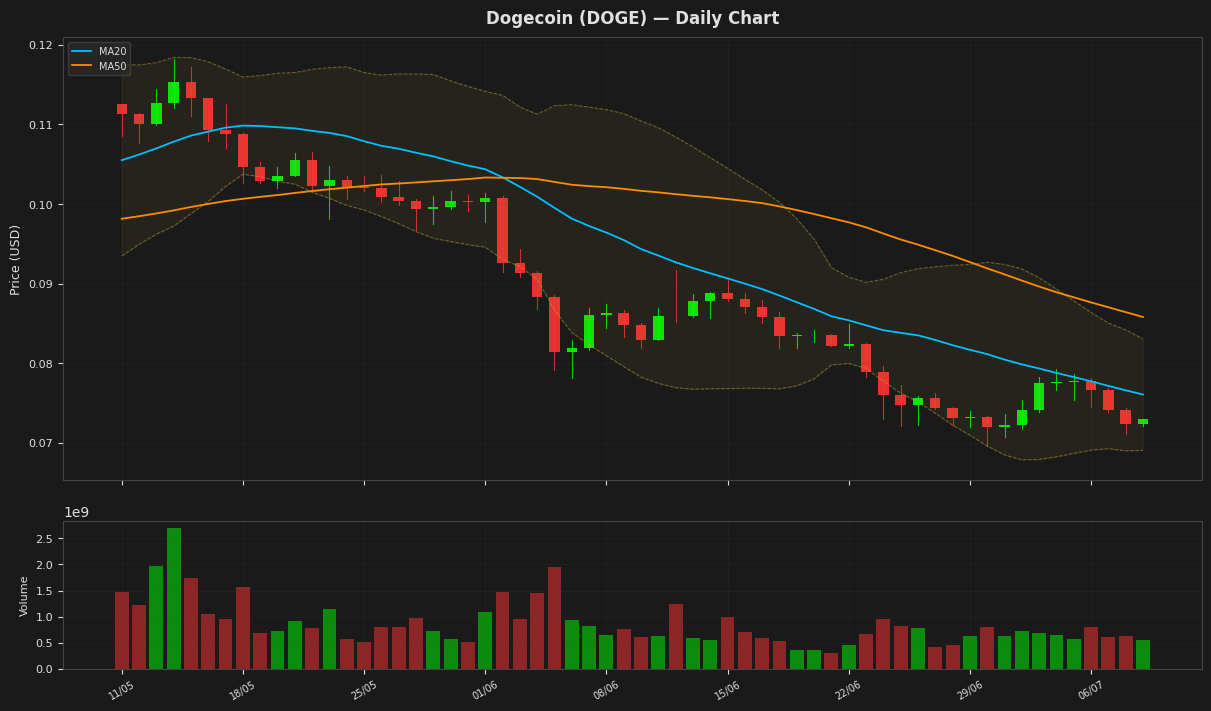
Dogecoin's current price is $0.072960, which is below both its MA20 and MA50, indicating a downtrend. The RSI is at 44.542684, suggesting the cryptocurrency is nearing oversold territory, while the MACD is below its signal line, indicating bearish momentum. The price is currently above the lower Bollinger Band, but below the upper band, showing some consolidation.
Disclaimer
The content on MarketsFN.com is provided for educational and informational purposes only. It does not constitute financial advice or investment recommendations. All investments involve risk. Past performance does not guarantee future results.