Crypto Market Sees Gains: Ripple, Ethereum, Dogecoin Lead the Charge
· Crypto · QuoteReporter
Crypto Market Sees Gains: Ripple, Ethereum, Dogecoin Lead the Charge
Crypto Market Report | July 21, 2026
📊 Crypto Market Overview
The cryptocurrency market is currently exhibiting a positive sentiment, with most major assets trading in the green. Bitcoin is leading the way, having risen by 1.44% to $66,170.75, with its Relative Strength Index (RSI) standing at 62.7, indicating a moderate level of bullish momentum. The MACD indicator is also positive, at 477.9121, further reinforcing the uptrend.
Other major cryptocurrencies, such as Ethereum and Ripple, are also posting gains, with increases of 1.84% and 1.86%, respectively. Ethereum's RSI is at 68.8, suggesting a slightly overbought condition, while Ripple's RSI remains relatively neutral at 55.4. Solana, on the other hand, is lagging behind, with a more muted gain of 0.69%, and an RSI of 42.5, indicating a potential oversold condition.
The recent surge in Bitcoin ETFs has contributed to the positive market sentiment, with a five-day inflow streak being recorded, the longest since May. This development is likely to have boosted investor confidence in the cryptocurrency market. Other news, such as the imminent launch of tokenized equities on Base and Grayscale's filing for a US Worldcoin ETF, has also been making headlines.
From a technical perspective, the MACD indicators for most major cryptocurrencies are either positive or showing signs of a potential crossover, suggesting a continued upward trend. However, some assets, such as Tron and BNB, are exhibiting more neutral or bearish signals, with their MACD indicators being negative. Overall, the cryptocurrency market is currently characterized by a mix of bullish and neutral signals, with a generally positive sentiment prevailing.
Other major cryptocurrencies, such as Ethereum and Ripple, are also posting gains, with increases of 1.84% and 1.86%, respectively. Ethereum's RSI is at 68.8, suggesting a slightly overbought condition, while Ripple's RSI remains relatively neutral at 55.4. Solana, on the other hand, is lagging behind, with a more muted gain of 0.69%, and an RSI of 42.5, indicating a potential oversold condition.
The recent surge in Bitcoin ETFs has contributed to the positive market sentiment, with a five-day inflow streak being recorded, the longest since May. This development is likely to have boosted investor confidence in the cryptocurrency market. Other news, such as the imminent launch of tokenized equities on Base and Grayscale's filing for a US Worldcoin ETF, has also been making headlines.
From a technical perspective, the MACD indicators for most major cryptocurrencies are either positive or showing signs of a potential crossover, suggesting a continued upward trend. However, some assets, such as Tron and BNB, are exhibiting more neutral or bearish signals, with their MACD indicators being negative. Overall, the cryptocurrency market is currently characterized by a mix of bullish and neutral signals, with a generally positive sentiment prevailing.
📰 Crypto News
- Bitcoin ETFs post five-day inflow streak, longest since May
- Base’s 1:1-backed tokenized equities launch ‘imminent,’ Pollak says
- Here’s what happened in crypto today
- Grayscale files S-1 for first US Worldcoin ETF
- Celsius co-founders Leon, Goldstein to pay FTC over $6M
- Binance & OKX users face $1,900 fines in Vietnam, Coinbase in China? Asia Express
- London Stock Exchange eyes overnight trading launch in 2027: FT
- Patrick Witt defers military training as CLARITY heads to Senate
- Democrats added certain consumer protection rules to CLARITY: Coinbase exec
- Tether Gold recognized as Accepted Spot Commodity in Abu Dhabi financial center
- Bitcoin defies recent tech stocks sell-off: Are bulls eyeing $70K rally?
- XRP jumps 4% as traders watch 'triangle breakout' toward $1.35
- Live markets: Bitcoin ETFs post a fifth straight day of inflows in a first since April
- UK Parliament begins inquiry into banking chokepoint for crypto businesses
- Bitcoin hits a two-week high near $65,500 as the chip trade turns back into a tailwind
🔍 Technical Analysis
Bitcoin (BTC) — +1.44%
$66,170.75 52W: $57,747.77 — $105,297.23
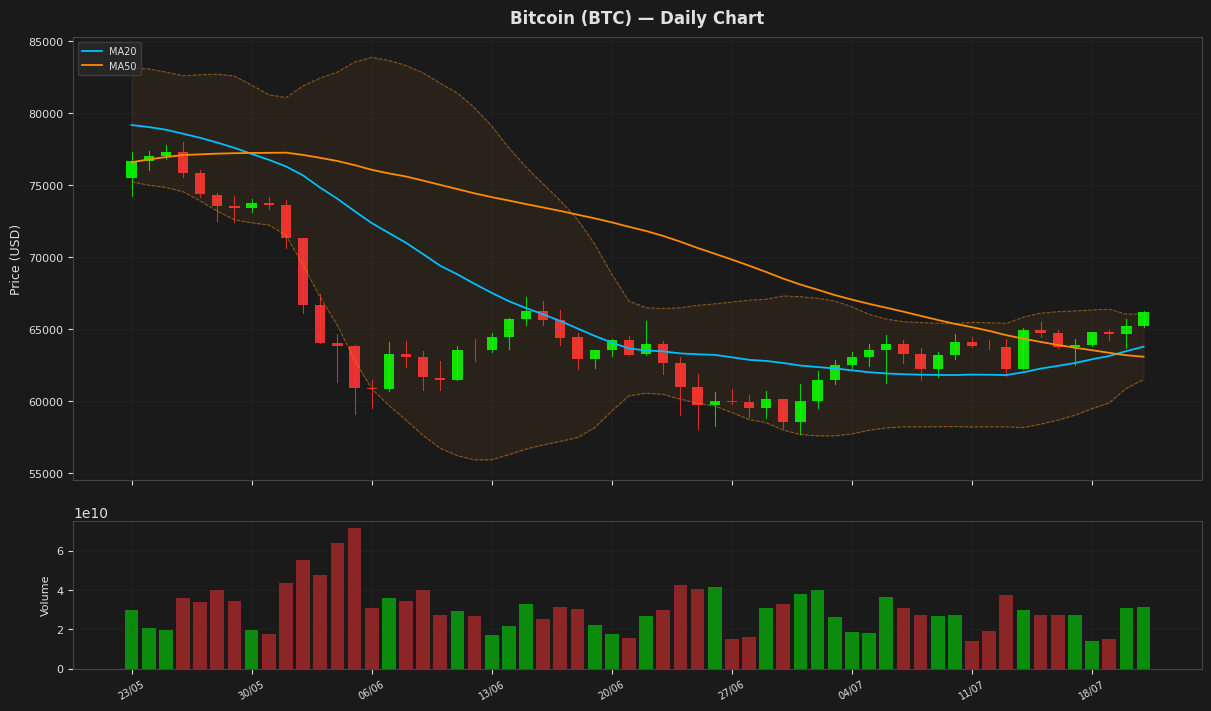
Bitcoin's price is currently trading near the upper band of the Bollinger Bands at $66,059.87, indicating a potential resistance level. The RSI is at 62.74, suggesting a neutral to slightly bullish sentiment. The MACD is above its signal line, indicating a bullish crossover. The ATR remains relatively high, indicating ongoing volatility in the market.
Ethereum (ETH) — +1.84%
$1,938.80 52W: $1,506.51 — $3,586.01
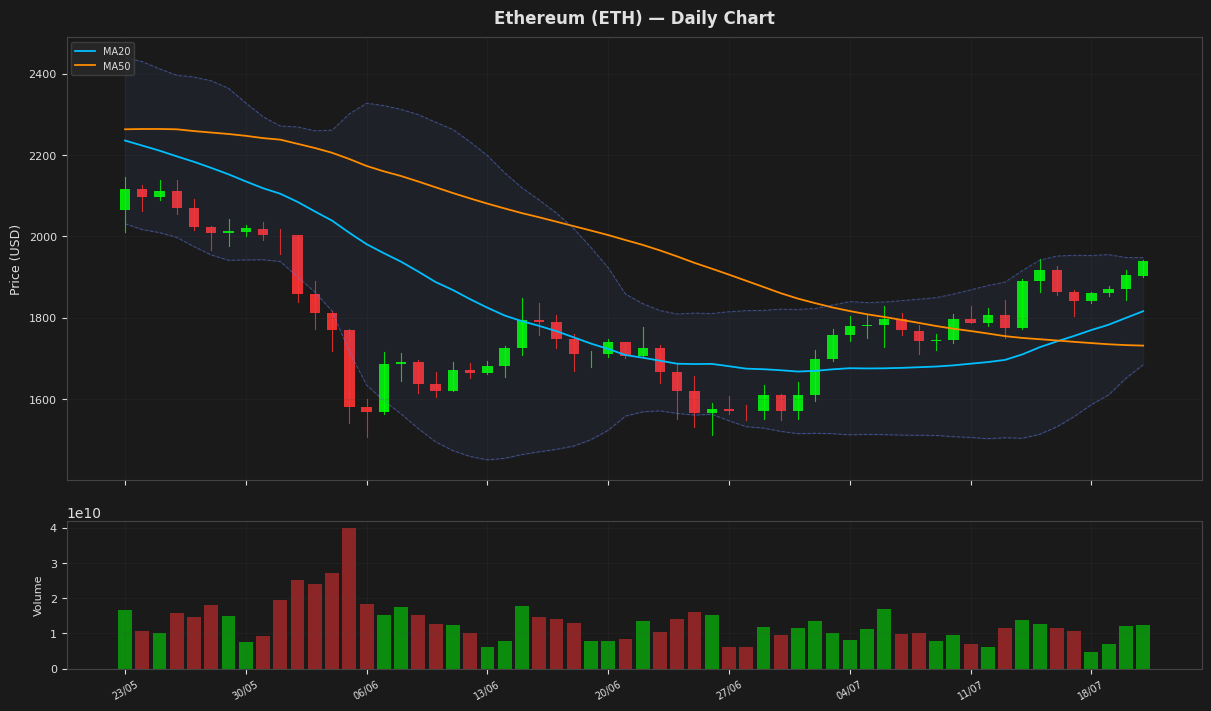
Ethereum's price is currently trading near the upper Bollinger Band at $1,938.80, indicating a potential resistance level, with the RSI at 68.77 suggesting a near-overbought condition. The MACD is above its signal line, indicating a bullish signal. The Average True Range indicates moderate volatility, and the price is above both the MA20 and MA50, showing a short-term uptrend.
Ripple (XRP) — +1.86%
$1.1328 52W: $1.0098 — $2.5200
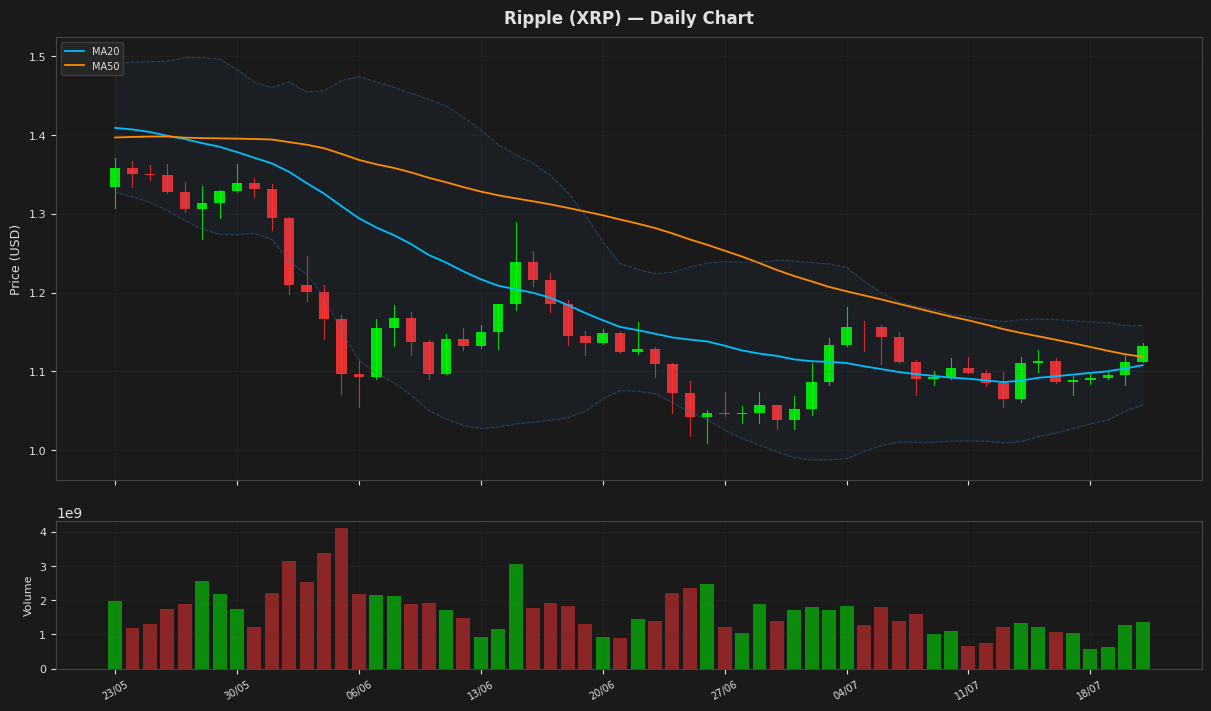
Ripple's price is currently trading above its MA20 and MA50, indicating a positive short-term trend. The RSI is near neutral at 55.404252, suggesting a balanced buying and selling pressure. The Bollinger Bands indicate that the price is near the upper band at $1.158048, potentially signaling a resistance level. The MACD is above its signal line, indicating a potential buying signal.
Solana (SOL) — +0.69%
$78.3300 52W: $60.4147 — $161.0141
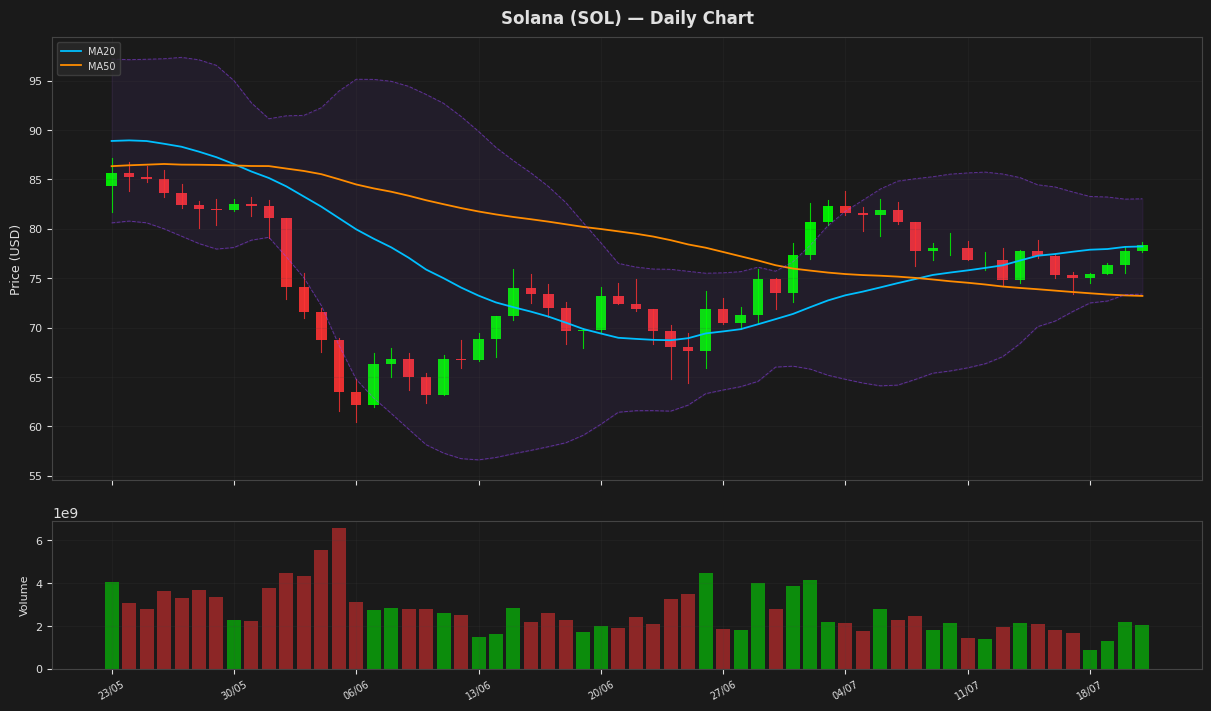
Solana's price is currently at $78.33, showing a slight increase of 0.69% and is trading near its 20-day moving average of $78.21. The Relative Strength Index (RSI) at 42.48 indicates that the asset is neither overbought nor oversold, suggesting a neutral stance. The MACD is below its signal line, indicating a potential bearish signal, while the Bollinger Bands suggest that the price is within a relatively stable range.
BNB (BNB) — +1.05%
$576.7200 52W: $538.5992 — $976.9578
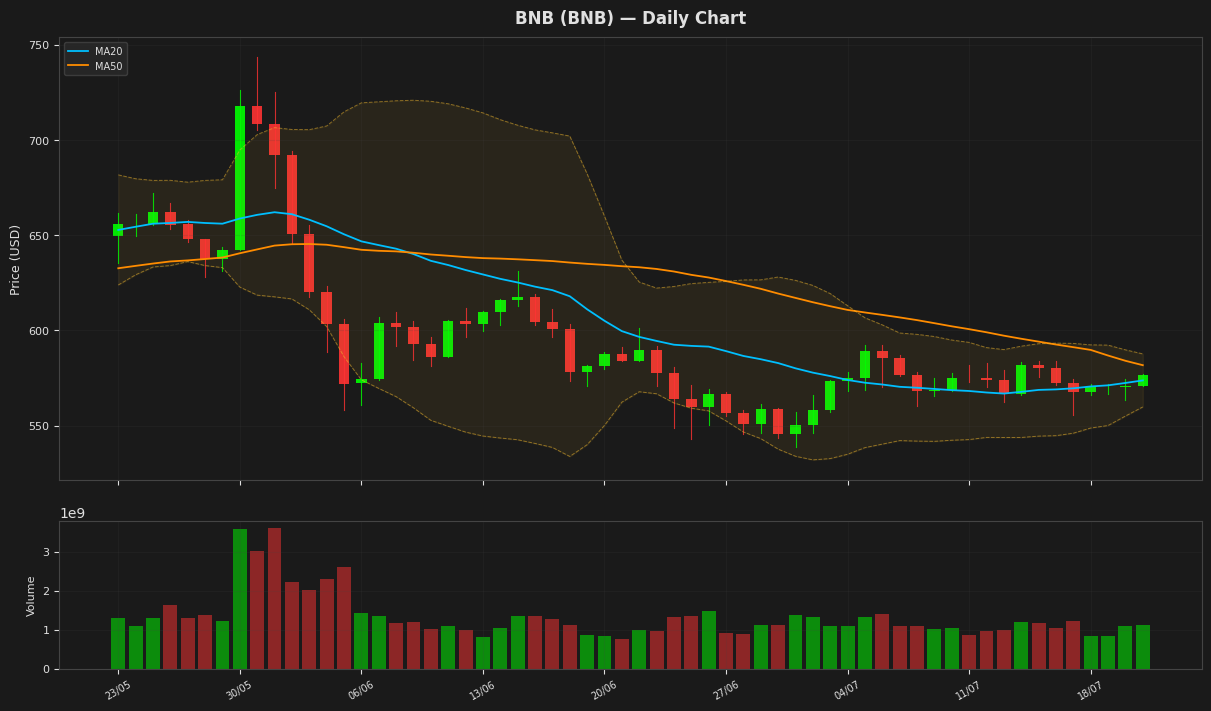
BNB is currently trading near its 20-day moving average of $573.74, indicating a relatively stable short-term trend. The Relative Strength Index (RSI) at 49.94 suggests a neutral market sentiment, while the MACD line is above its signal line, indicating a potential bullish crossover. The Bollinger Bands suggest that the price is within a relatively narrow trading range, with the upper and lower bands at $587.66 and $559.82 respectively.
Tron (TRX) — -0.09%
$0.326332 52W: $0.268138 — $0.376332
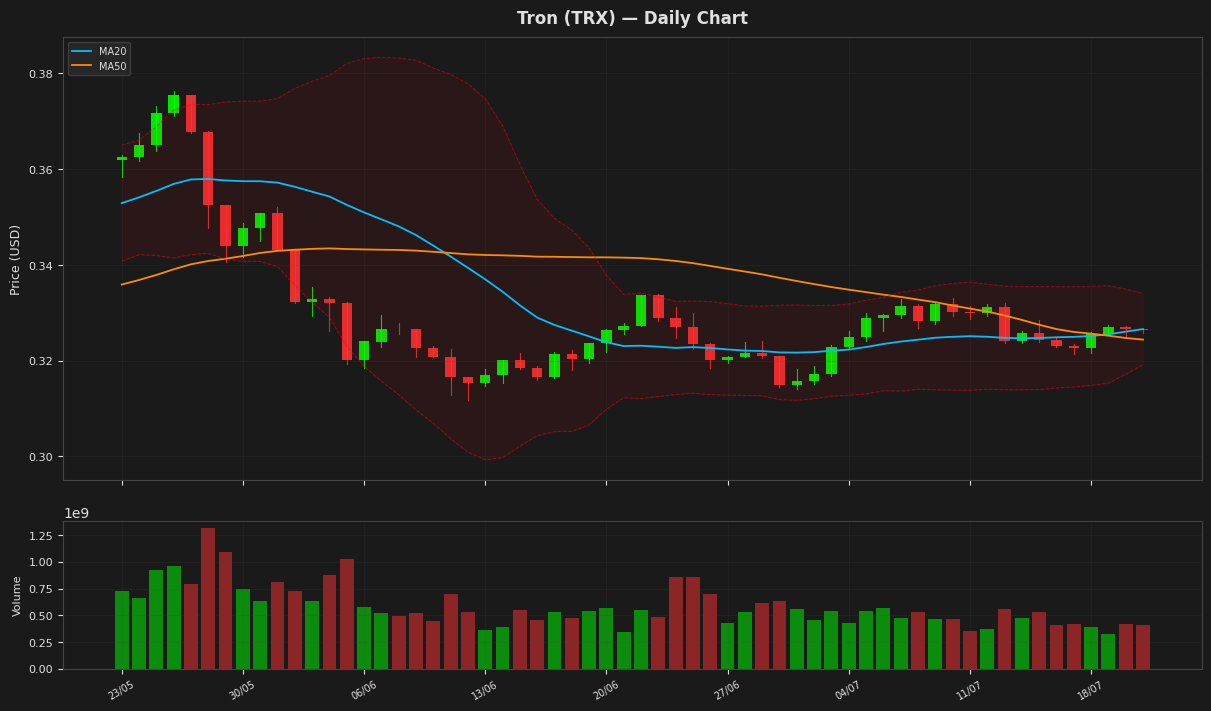
Tron's price is currently at $0.326332, showing a minimal decline of 0.09% and is positioned near the middle of the Bollinger Bands, indicating a lack of strong directional momentum. The RSI is at 40.69, suggesting that TRX is not deeply oversold but has some room to recover. The MACD is below its signal line, indicating a bearish signal, while the ATR indicates low volatility.
Dogecoin (DOGE) — +1.83%
$0.073460 52W: $0.069611 — $0.178284
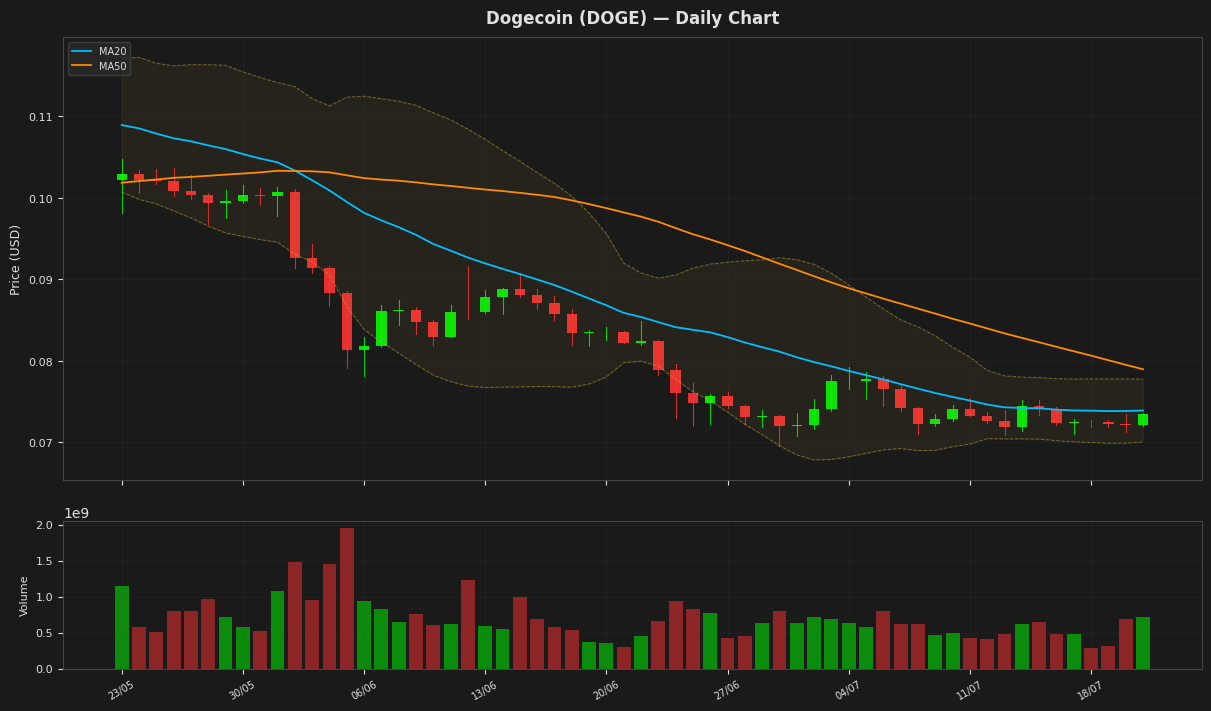
Dogecoin's price is currently trading near its 20-day moving average of $0.07392, indicating a lack of strong directional momentum. The Relative Strength Index (RSI) at 47.07 suggests the cryptocurrency is not in oversold or overbought territory. The Bollinger Bands indicate that the price is closer to the lower band at $0.07006, showing some support at this level. The MACD is below its signal line, indicating a bearish signal.
Disclaimer
The content on MarketsFN.com is provided for educational and informational purposes only. It does not constitute financial advice or investment recommendations. All investments involve risk. Past performance does not guarantee future results.