Crypto Market Sees Surge: Ripple, Ethereum, Solana Lead Gains
· Crypto · QuoteReporter
Crypto Market Sees Surge: Ripple, Ethereum, Solana Lead Gains
Crypto Market Report | June 15, 2026
📊 Crypto Market Overview
The cryptocurrency market is exhibiting a mixed sentiment today, with some assets showing notable gains while others remain subdued. Bitcoin, the largest cryptocurrency by market capitalization, is trading at $66,494.52, up 1.19% on the day. The Relative Strength Index (RSI) for BTC stands at 37.8, indicating a neutral territory, while the MACD is negative at -2823.30, suggesting a bearish trend.
Ethereum and several altcoins, including Ripple and Solana, are outperforming Bitcoin today, with gains of 5.29%, 6.54%, and 5.19%, respectively. Ethereum's RSI is at 38.8, and its MACD is negative at -105.64, indicating a similar bearish trend to Bitcoin. Ripple's RSI is at 47.0, closer to neutral, while Solana's RSI is at 42.0.
The macro context remains relevant, with recent news highlighting the ongoing developments in the regulatory landscape. The CFTC's hiring of an adviser with blockchain forensics expertise underscores the growing importance of regulatory oversight in the cryptocurrency space. Meanwhile, institutional accumulation continues, with BitMine boosting its Ethereum holdings and MicroStrategy's subsidiary, Saylor's Strategy, purchasing 1,587 BTC for $100 million.
From a technical perspective, several assets are showing signs of oversold conditions, with BNB and Tron having RSI values below 35. Dogecoin is also in a similar territory, with an RSI of 32.6. The negative MACD values across most assets indicate a prevailing bearish sentiment in the market. Kraken's rollout of perpetual futures for US traders through a CFTC-regulated venue may contribute to increased market participation. Overall, the cryptocurrency market is displaying a complex picture, with both positive and negative signals present across various assets and indicators.
📰 Crypto News
- CFTC hires SEC crypto task force adviser with blockchain forensics chops
- BitMine boosts ETH holdings closer to $10B as bear market accumulation continues
- Kraken rolls out perpetual futures for US traders through CFTC-regulated venue
- These Bitcoin charts show how BTC price could hit $100K before October
- Bitcoin analysis warns over BTC price rejection as $67K approaches
- Pudgy Penguins winds down Pudgy Party mobile game
- Saylor’s Strategy buys 1,587 BTC for $100M, holdings hit 846.8K
- Tokenization could push DeFi assets to $2.7T by 2030: Standard Chartered
- Can BTC rebound to $69K as oil price plunges? Five things to know in Bitcoin this week
- Japan’s Bitbank cracks down on Polymarket-linked transfers
- Hyperliquid loses Anthropic, OpenAI markets as creator shuts down project
- If America wants to lead in crypto, it must protect the people who build it
- ‘Crypto spring’ is here, says one analyst after bitcoin's key signals turn bullish
- Kraken debuts U.S. perpetual futures as crypto derivatives move onshore
- Coinbase's Brian Armstrong says bitcoin may have bottomed at $60,000
🔍 Technical Analysis
Bitcoin (BTC) — +1.19%
$66,494.52 52W: $59,108.92 — $125,184.02
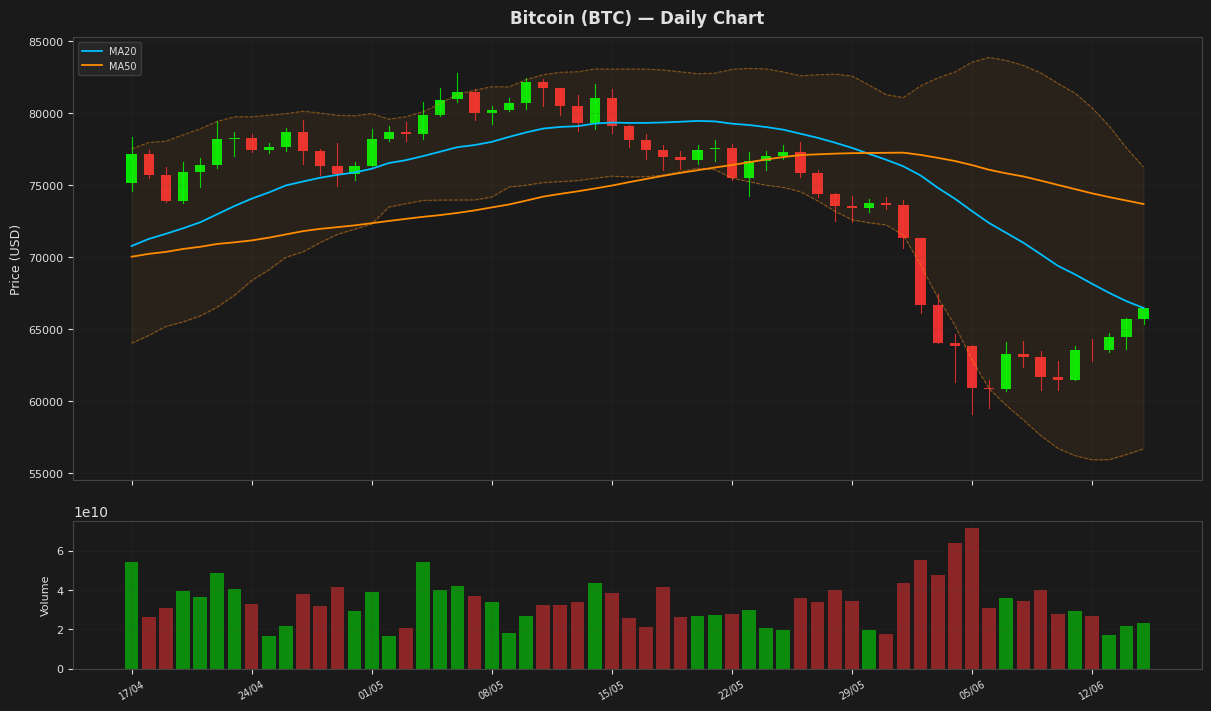
Bitcoin's price is currently near its 20-day moving average, indicating a lack of strong directional momentum. The RSI is below 40, suggesting some oversold conditions, while the MACD is below its signal line, indicating a bearish trend. The Bollinger Bands suggest that the price is still within a relatively wide trading range, with the upper band at $76,248 and the lower band at $56,689. The ATR indicates moderate volatility.
Ethereum (ETH) — +5.29%
$1,815.89 52W: $1,506.51 — $4,755.22
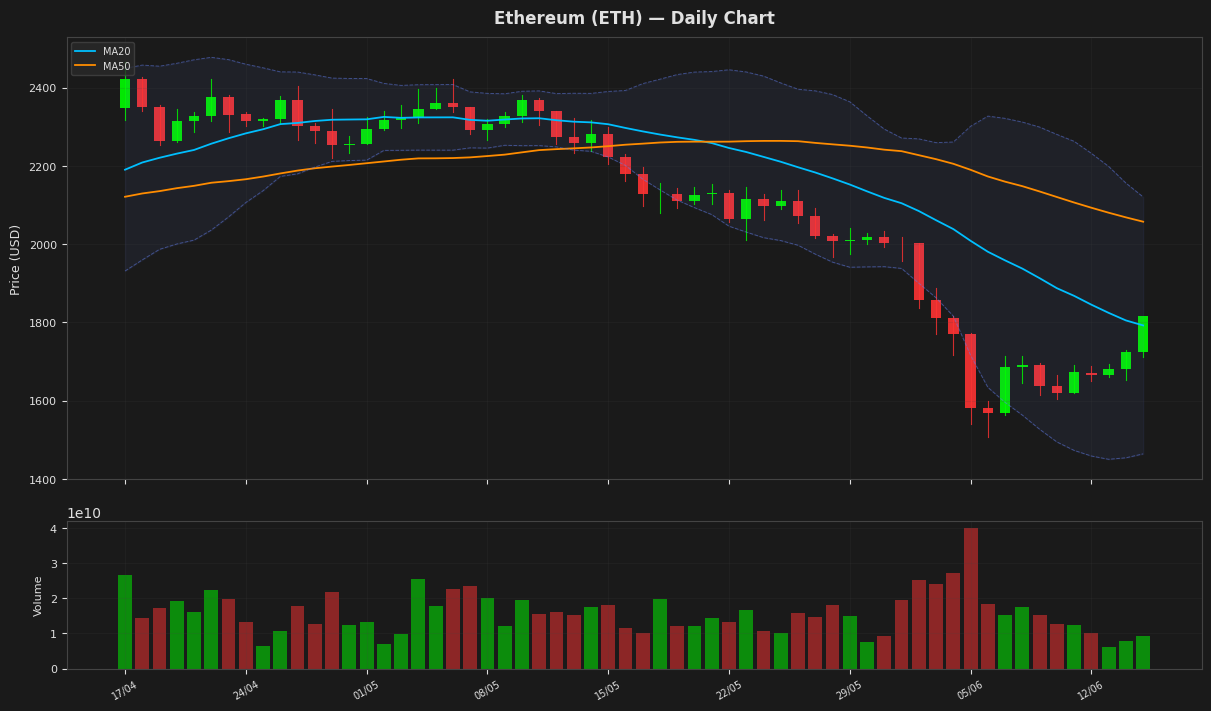
Ethereum's price is currently at $1,815.89, showing a daily increase of 5.29%, and is nearing the MA20 at $1,792.50, indicating potential support. The RSI(14) at 38.79 suggests the asset is approaching oversold territory, while the MACD line is above the signal line, hinting at a potential bullish crossover. The price is also within the lower to middle range of the Bollinger Bands.
Ripple (XRP) — +6.54%
$1.2634 52W: $1.0547 — $2.9997
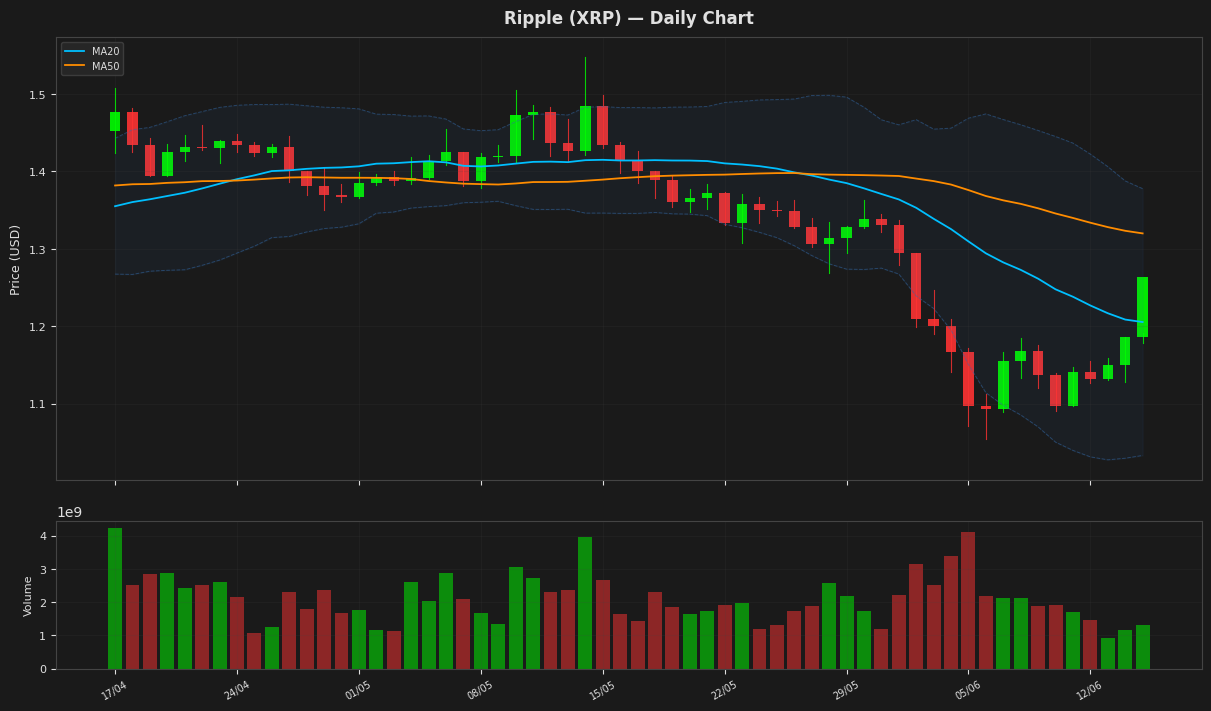
Ripple's price is currently at $1.263400, showing a daily increase of 6.54% as it trades near the middle of its Bollinger Bands, with the upper and lower bands at $1.377769 and $1.033179 respectively. The RSI is at 47.043274, indicating a neutral position, while the MACD is above its signal line, suggesting a potential bullish crossover. The price is also above its MA20, indicating a short-term uptrend.
Solana (SOL) — +5.19%
$74.8600 52W: $60.4147 — $235.0865
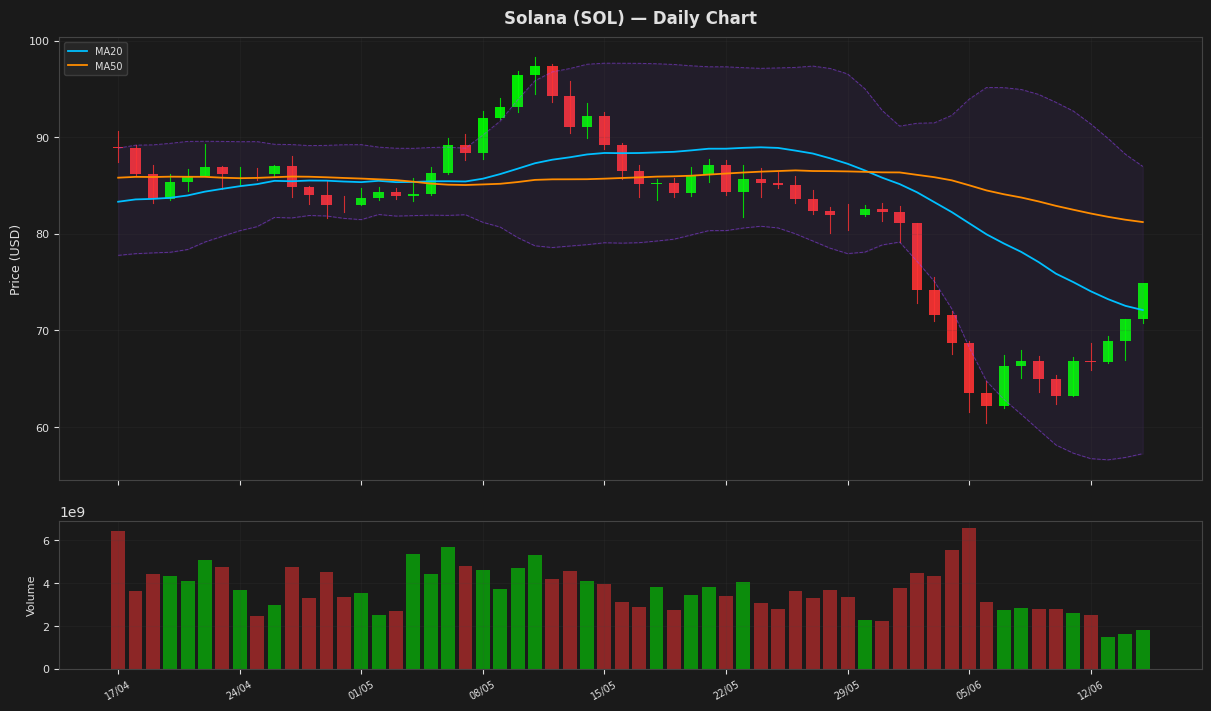
Solana's current price is $74.86, showing a 5.19% daily gain, as it trades above its MA20 at $72.10 but below its MA50 at $81.21. The RSI is at 42.01, indicating a neutral zone, while the MACD is below its signal line, suggesting a bearish trend. The price is also within the Bollinger Bands, with the upper band at $86.97 and lower band at $57.24.
BNB (BNB) — +0.52%
$619.3000 52W: $558.3898 — $1,370.55
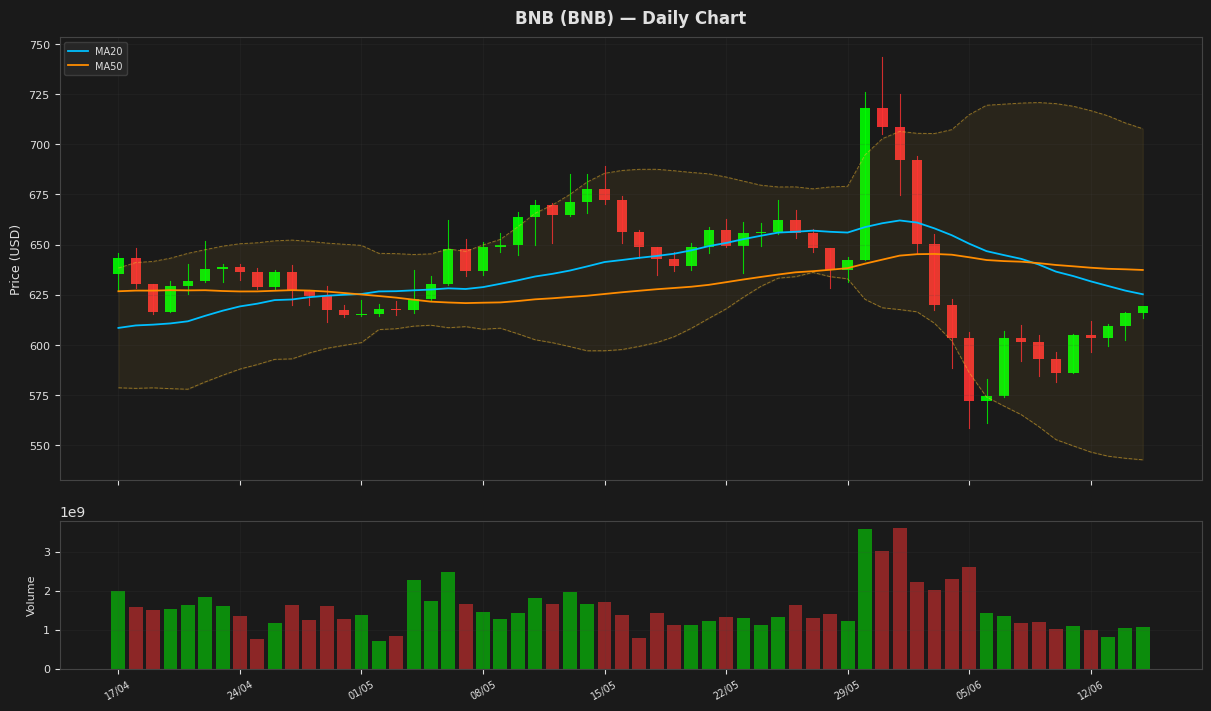
BNB is currently trading at $619.30 with a slight daily increase of 0.52%, nearing its 52-week low of $558.39. The RSI(14) at 32.25 indicates oversold conditions, while the MACD is below the signal line, suggesting a bearish trend. The price is closer to the lower Bollinger Band at $542.72, indicating potential support.
Tron (TRX) — +0.15%
$0.320616 52W: $0.268138 — $0.376332
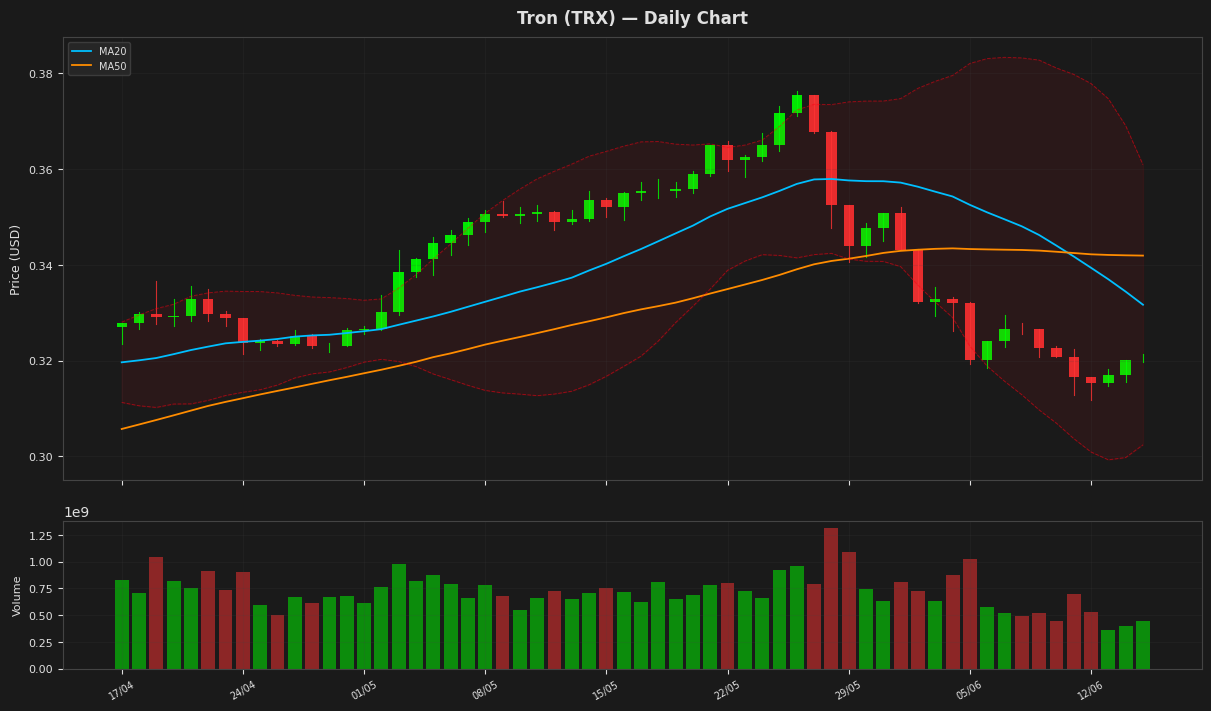
Tron's price is currently at $0.320616, showing a minimal daily gain of 0.15%. The RSI(14) value of 26.23777 indicates that TRX is in oversold territory, while the MACD is below the signal line, suggesting a bearish signal. The price is near the lower Bollinger Band at $0.302425, indicating potential support. The ATR(14) suggests low volatility.
Dogecoin (DOGE) — +0.26%
$0.089000 52W: $0.078095 — $0.267863
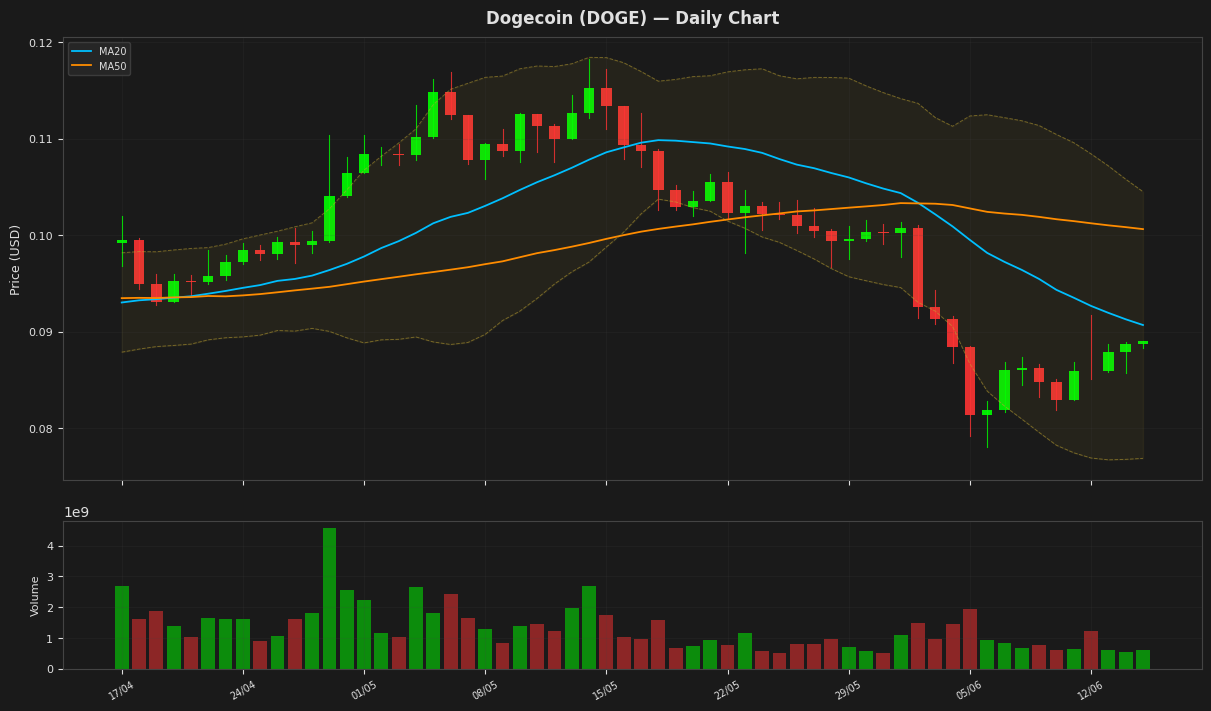
Dogecoin's current price is $0.089000, showing a minor daily gain of 0.26%. The RSI(14) value of 32.59 indicates the cryptocurrency is nearing oversold territory, while the MACD is below its signal line, suggesting a bearish trend. The price is currently below both the MA20 and MA50, and is closer to the lower Bollinger Band, indicating potential support around $0.076893.
Disclaimer
The content on MarketsFN.com is provided for educational and informational purposes only. It does not constitute financial advice or investment recommendations. All investments involve risk. Past performance does not guarantee future results.