Crypto Market Slumps: Bitcoin, Ethereum, Solana Lead Losses Today.
· Crypto · QuoteReporter
Crypto Market Slumps: Bitcoin, Ethereum, Solana Lead Losses Today.
Crypto Market Report | May 27, 2026
📊 Crypto Market Overview
The cryptocurrency market is currently experiencing a downturn, with most major assets trading in the red. Bitcoin, the largest cryptocurrency by market capitalization, has seen its value decline by 2.27% over the past 24 hours to $75,528.4062. The Relative Strength Index (RSI) for Bitcoin stands at 31.9, indicating that it is approaching oversold territory. The Moving Average Convergence Divergence (MACD) is negative at -344.6589, suggesting a bearish trend.
Other major cryptocurrencies, such as Ethereum, Ripple, and Solana, are also trading lower, with declines ranging from 1.49% to 1.90%. Their RSI values are also in the oversold or near-oversold range, with Ethereum's RSI at 26.0 and Solana's at 25.3. The MACD indicators for these assets are also negative, reinforcing the bearish sentiment.
In contrast, Tron is bucking the trend, with a 0.39% gain over the past 24 hours and an RSI of 85.8, indicating overbought conditions. The MACD is positive at 0.0089, suggesting a continued upward trend.
The broader market context is influenced by various factors, including the latest news and developments. The launch of a new tool by Base to connect crypto wallets to AI agents and the acquisition of a Kentucky AI data center site by TeraWulf are among the notable news items. Additionally, regulatory developments, such as Trump's backing of the Commodity Futures Trading Commission's (CFTC) authority over prediction markets, are also shaping the market landscape.
Notable technical signals include the oversold RSI readings for several major cryptocurrencies, which may indicate a potential buying opportunity for investors. However, the negative MACD indicators suggest that the bearish trend may continue in the short term. Overall, the cryptocurrency market is experiencing a period of volatility, with various factors influencing market sentiment.
Other major cryptocurrencies, such as Ethereum, Ripple, and Solana, are also trading lower, with declines ranging from 1.49% to 1.90%. Their RSI values are also in the oversold or near-oversold range, with Ethereum's RSI at 26.0 and Solana's at 25.3. The MACD indicators for these assets are also negative, reinforcing the bearish sentiment.
In contrast, Tron is bucking the trend, with a 0.39% gain over the past 24 hours and an RSI of 85.8, indicating overbought conditions. The MACD is positive at 0.0089, suggesting a continued upward trend.
The broader market context is influenced by various factors, including the latest news and developments. The launch of a new tool by Base to connect crypto wallets to AI agents and the acquisition of a Kentucky AI data center site by TeraWulf are among the notable news items. Additionally, regulatory developments, such as Trump's backing of the Commodity Futures Trading Commission's (CFTC) authority over prediction markets, are also shaping the market landscape.
Notable technical signals include the oversold RSI readings for several major cryptocurrencies, which may indicate a potential buying opportunity for investors. However, the negative MACD indicators suggest that the bearish trend may continue in the short term. Overall, the cryptocurrency market is experiencing a period of volatility, with various factors influencing market sentiment.
📰 Crypto News
- Base launches new tool to connect crypto wallets to AI agents
- Tom Lee predicts supercycle amid Bitmine’s largest Ethereum buy in 2026
- Trump backs CFTC authority over prediction markets
- Bitcoin drops after $78K pop, but ‘value investor’ keeps ‘hoovering up cheap’ BTC
- HYPE chases new highs as ETF inflows, institutional adoption accelerate
- Crypto advocacy group challenges Senator Warren's claims on OCC charters
- Bitcoin mining stocks jump as AI infrastructure boom boosts sector outlook
- UK authorities sanction HTX crypto exchange over support for Russia
- TeraWulf acquires Kentucky AI data center site with planned 1 GW capacity
- XRP steadies near $1.32 as failed breakout keeps focus on narrowing trading range
- Traders watch bitcoin 'golden cross' as BTC slides to near $75,000, ZEC dives 9%
- Trump praises prediction markets, defends CFTC as court cases compound
- Joe Lubin-backed Ethereum treasury firm SharpLink to join the Russel indexes
- UK sanctions Huobi and ruble stablecoin issuer in crackdown on Russia crypto networks
- Some Non-Enhanced Athletes Beat Their Juiced Rivals at the 'Steroid Olympics'
🔍 Technical Analysis
Bitcoin (BTC) — -2.27%
$75,528.41 52W: $60,074.20 — $126,198.07
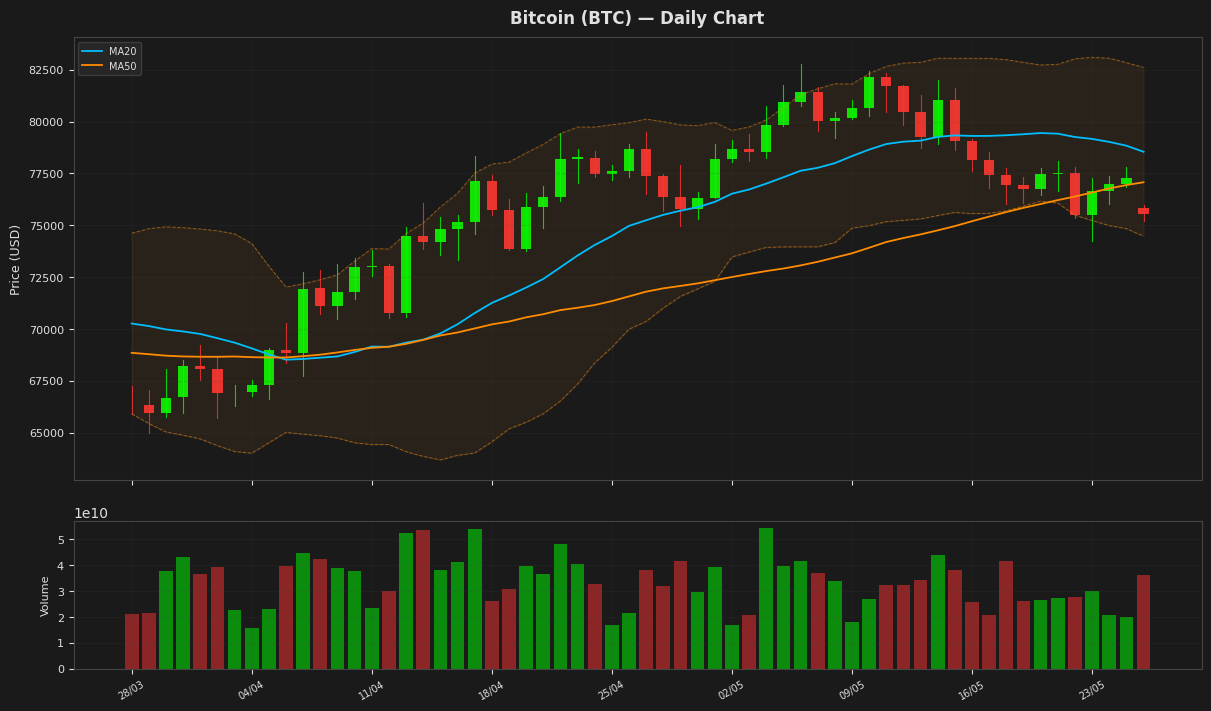
Bitcoin's price is currently at $75,528, showing a daily decline of 2.27% and sitting near the lower Bollinger Band at $74,473, indicating potential oversold conditions as the RSI(14) is at 31.88. The MACD is below its signal line, suggesting a bearish trend. The Average True Range indicates high volatility, with a value of $1,971.
Ethereum (ETH) — -1.90%
$2,071.33 52W: $1,748.63 — $4,755.22
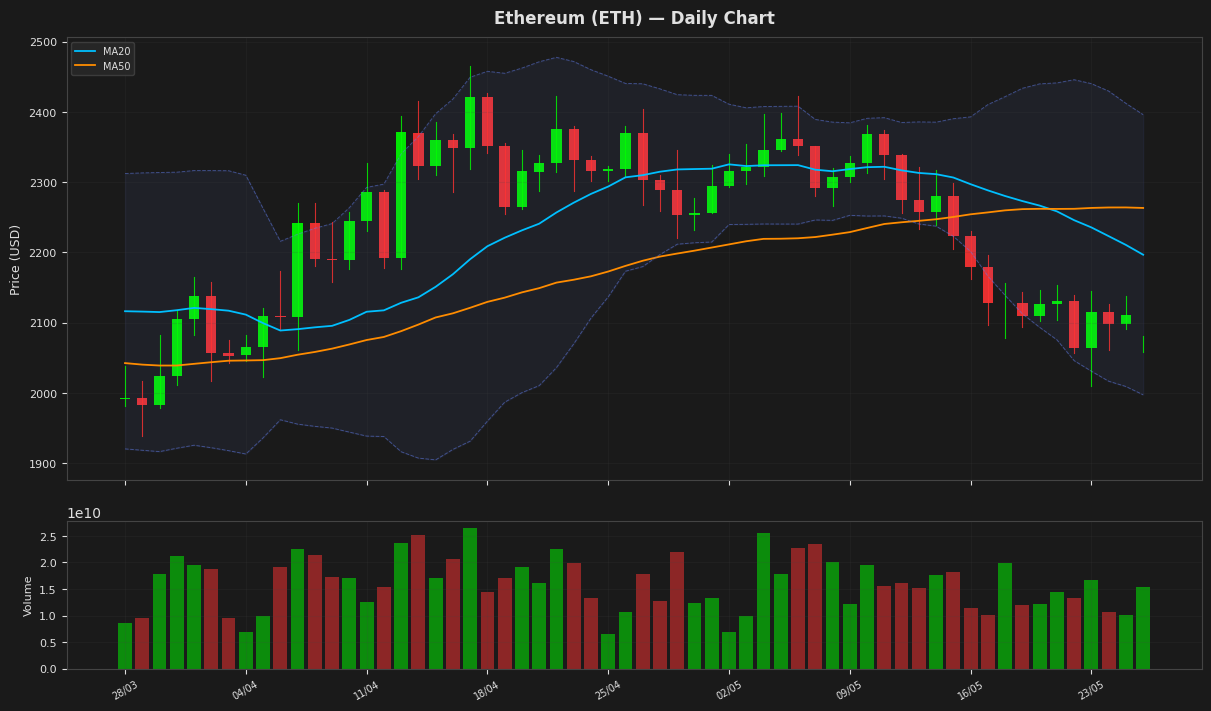
Ethereum's price is currently at $2,071.33, showing a daily decline of 1.90% and sitting near the lower Bollinger Band at $1,997.46, indicating potential oversold conditions as supported by the RSI(14) value of 26.03. The MACD is below its signal line, suggesting bearish momentum. The price is also below both the MA20 and MA50, further indicating a downtrend.
Ripple (XRP) — -1.49%
$1.3293 52W: $1.1335 — $3.1374
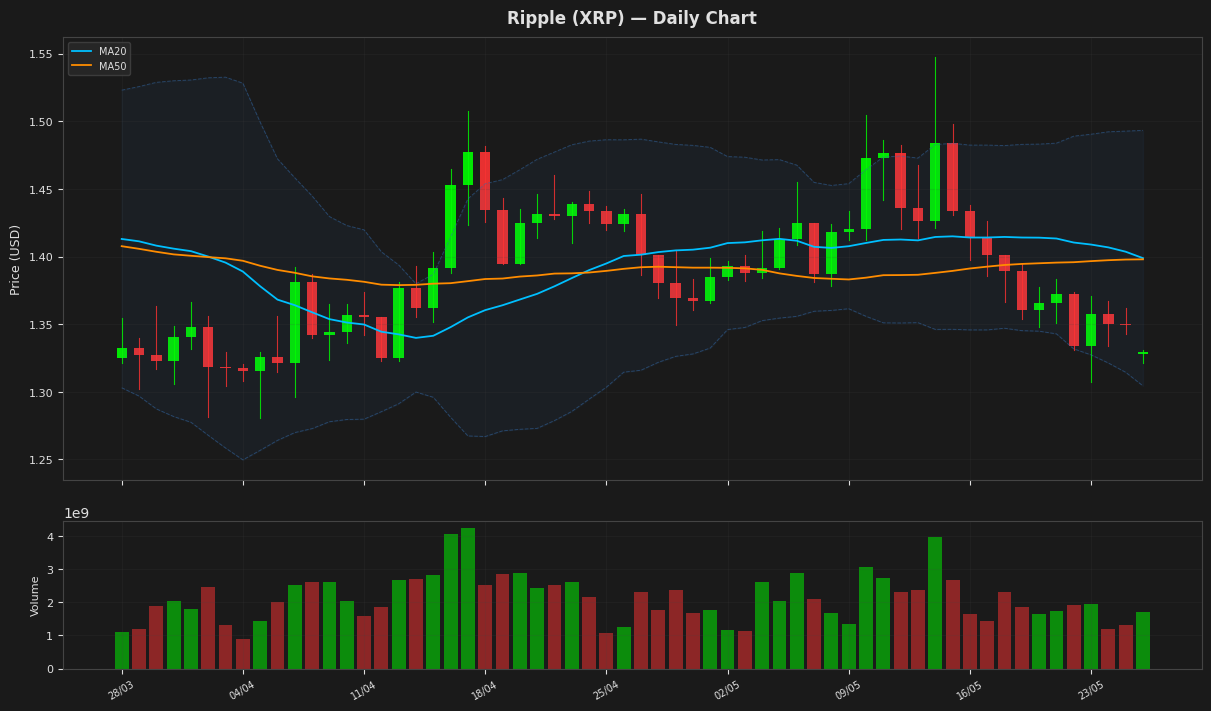
Ripple's price is currently at $1.329300, showing a decline of 1.49% for the day, and is positioned near the lower Bollinger Band at 1.304403, indicating potential oversold conditions. The RSI(14) value of 31.769046 further supports this, suggesting the asset may be undervalued. The MACD is below the signal line, indicating a bearish trend, but the proximity to the lower Bollinger Band may signal a potential reversal. The ATR(14) of 0.046841 indicates relatively low volatility.
Solana (SOL) — -1.69%
$83.5700 52W: $68.6918 — $253.2099
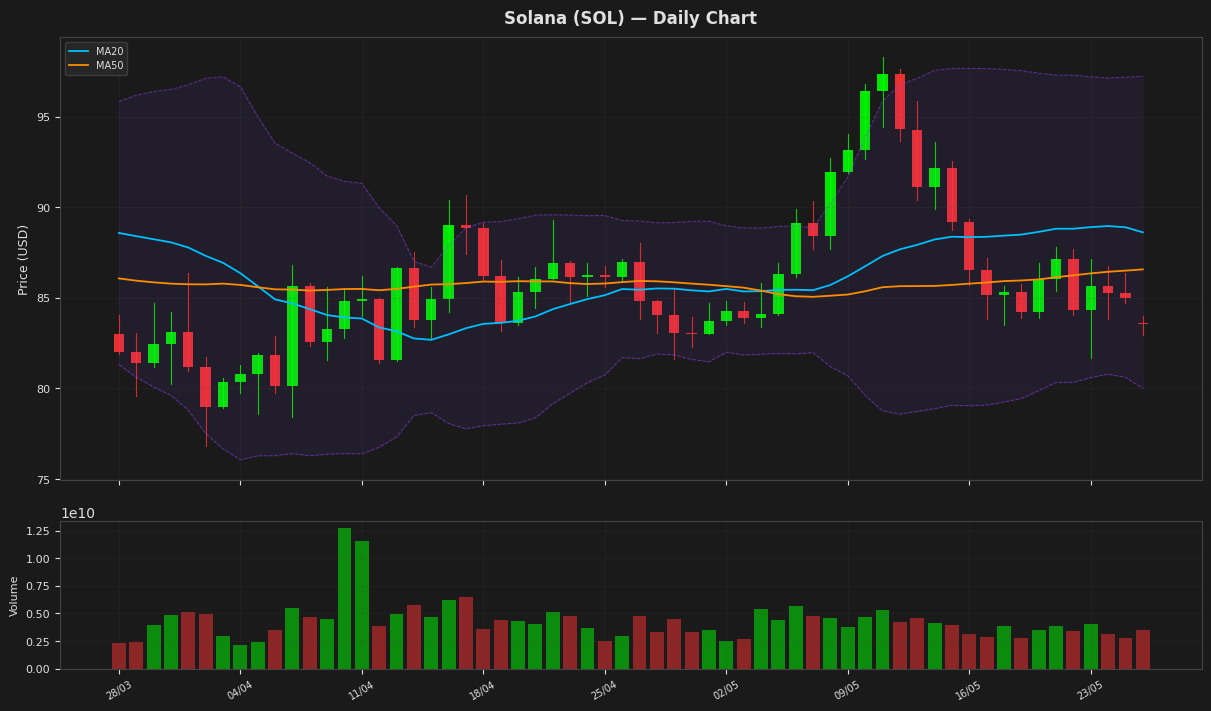
Solana's price is currently at $83.57, showing a decline of 1.69% for the day, and is positioned near the lower Bollinger Band at $79.99, indicating potential oversold conditions. The RSI(14) value of 25.30 further supports this, suggesting the asset may be due for a rebound. The MACD is negative and below its signal line, indicating bearish momentum. The price is still above its 52-week low of $68.69.
BNB (BNB) — -1.37%
$653.2100 52W: $570.6840 — $1,370.55
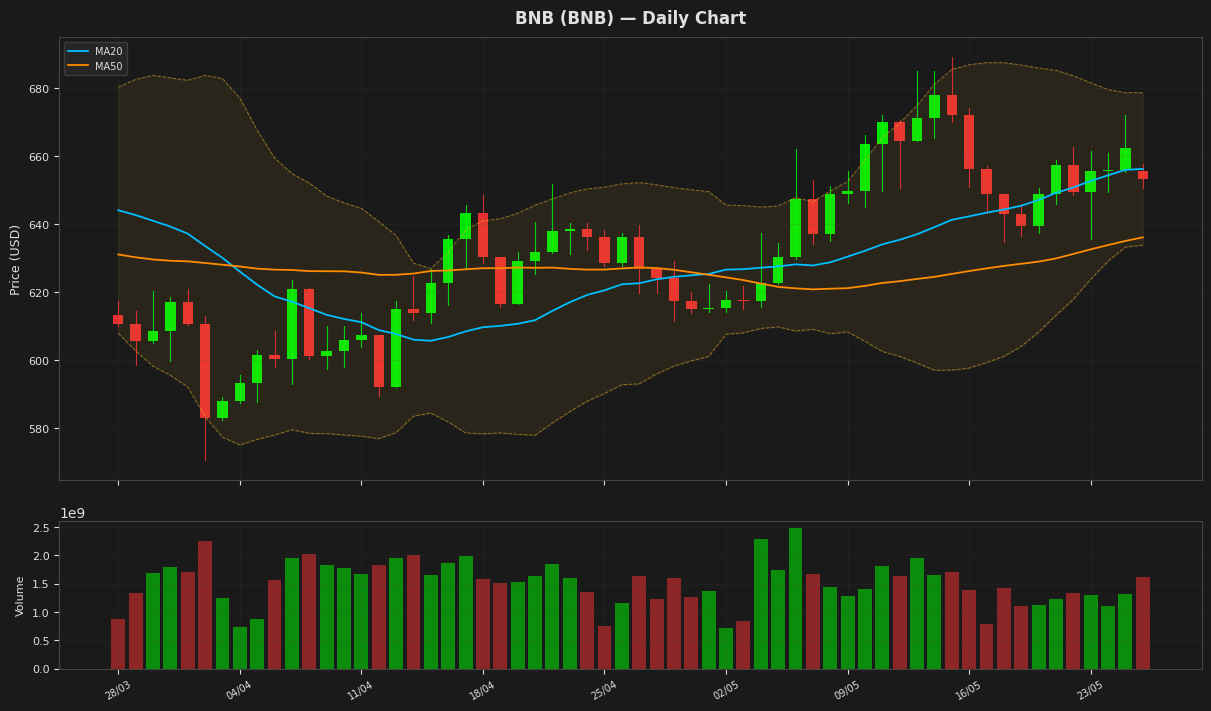
BNB is currently trading at $653.21, slightly below its 20-day moving average of $656.29, indicating a lack of strong upward momentum. The Relative Strength Index (RSI) at 44.31 suggests that the asset is nearing oversold territory, while the MACD line below the signal line indicates a bearish signal. The price is hovering near the lower end of the Bollinger Bands, with the lower band at $633.87, suggesting potential support.
Tron (TRX) — +0.39%
$0.373098 52W: $0.268138 — $0.375346
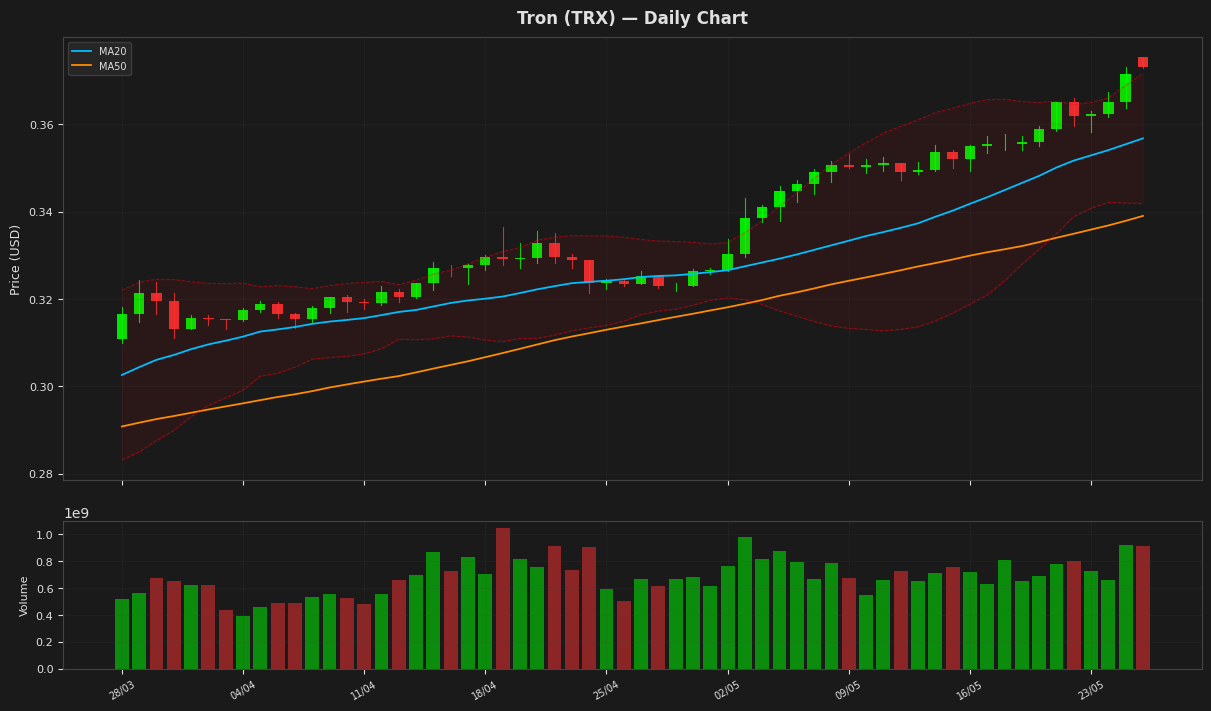
Tron's price is currently at $0.373098, near its 52-week high of $0.375346, indicating strong upward momentum. The RSI(14) value of 85.807275 suggests that TRX is overbought, potentially leading to a price correction. The MACD is above its signal line, indicating a bullish signal. The price is also near the upper Bollinger Band, further indicating potential overbought conditions.
Dogecoin (DOGE) — -0.65%
$0.101400 52W: $0.081573 — $0.287902
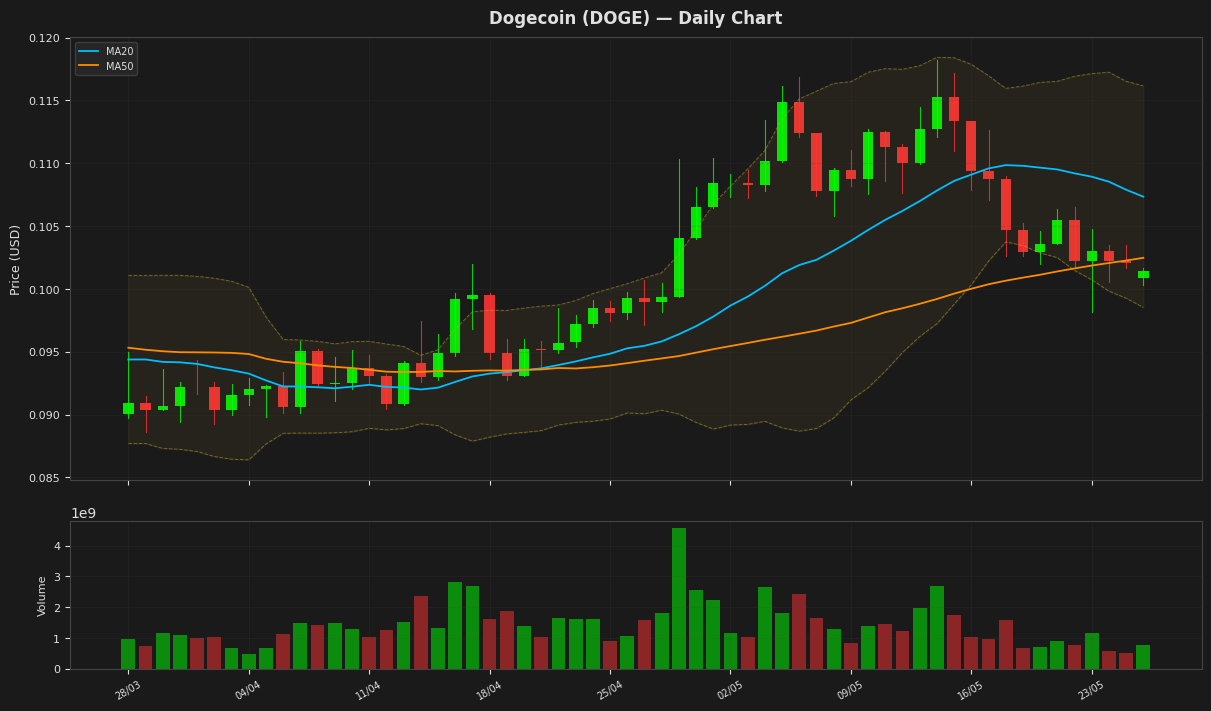
Dogecoin's price is currently at $0.101400, showing a decline of 0.65% for the day, and is positioned near the lower Bollinger Band at $0.098525, indicating potential oversold conditions. The RSI(14) value of 33.276393 further supports this, as it is below 40, suggesting the cryptocurrency may be due for a rebound. The MACD line is below the signal line, indicating a bearish trend.
Disclaimer
The content on MarketsFN.com is provided for educational and informational purposes only. It does not constitute financial advice or investment recommendations. All investments involve risk. Past performance does not guarantee future results.