Crypto Market Slumps: Dogecoin, Solana, and Bitcoin Lead Losses Today
· Crypto · QuoteReporter
Crypto Market Slumps: Dogecoin, Solana, and Bitcoin Lead Losses Today
Crypto Market Report | July 22, 2026
📊 Crypto Market Overview
The cryptocurrency market is currently experiencing a mixed sentiment, with most major assets trading in the red. Bitcoin, the largest cryptocurrency by market capitalization, is down 0.78% today, trading at $65,985.52. The Relative Strength Index (RSI) for Bitcoin stands at 66.8, indicating a neutral to slightly overbought condition, while the Moving Average Convergence Divergence (MACD) is at 588.22, suggesting a continued bullish trend.
Other major cryptocurrencies, such as Ethereum and Solana, are also trading lower, with Ethereum down 0.38% to $1,920.96 and Solana down 0.98% to $77.34. Ethereum's RSI is at 71.0, indicating an overbought condition, while Solana's RSI is at 48.3, suggesting a neutral stance. The MACD indicators for these assets are also providing mixed signals, with Ethereum's at 47.56 and Solana's at 0.46.
The recent inflow of funds into Bitcoin ETFs, with a six-day streak continuing and $203 million added, is a positive development for the market. However, the news of Balance Coin crashing 99% after a reported $915,000 exploit is a reminder of the risks associated with investing in cryptocurrencies. The overall macro context, including the yen hitting a 40-year low, is also worth noting, as it can impact investor sentiment and market dynamics.
From a technical perspective, the RSI and MACD indicators are providing mixed signals across the major cryptocurrencies. While some assets, such as Ethereum, are showing signs of being overbought, others, like Solana, are indicating a more neutral stance. Overall, the cryptocurrency market is experiencing a period of consolidation, with investors awaiting key developments, such as Alphabet's earnings, to gauge the impact on the AI trade and the broader market.
Other major cryptocurrencies, such as Ethereum and Solana, are also trading lower, with Ethereum down 0.38% to $1,920.96 and Solana down 0.98% to $77.34. Ethereum's RSI is at 71.0, indicating an overbought condition, while Solana's RSI is at 48.3, suggesting a neutral stance. The MACD indicators for these assets are also providing mixed signals, with Ethereum's at 47.56 and Solana's at 0.46.
The recent inflow of funds into Bitcoin ETFs, with a six-day streak continuing and $203 million added, is a positive development for the market. However, the news of Balance Coin crashing 99% after a reported $915,000 exploit is a reminder of the risks associated with investing in cryptocurrencies. The overall macro context, including the yen hitting a 40-year low, is also worth noting, as it can impact investor sentiment and market dynamics.
From a technical perspective, the RSI and MACD indicators are providing mixed signals across the major cryptocurrencies. While some assets, such as Ethereum, are showing signs of being overbought, others, like Solana, are indicating a more neutral stance. Overall, the cryptocurrency market is experiencing a period of consolidation, with investors awaiting key developments, such as Alphabet's earnings, to gauge the impact on the AI trade and the broader market.
📰 Crypto News
- Bitcoin ETFs extend inflow streak to six days with $203M added
- Here’s what happened in crypto today
- Balance Coin crashes 99% after reported $915K exploit
- OpenAI says AI models escaped containment to hack Hugging Face
- Balaji’s Network School turns to Kazakhstan amid Malaysia setback
- CLARITY Act could help CFTC deal with prediction markets: Lawyer
- Movement Labs files for Chapter 11 bankruptcy after months of MOVE token turmoil
- Live updates: Bitcoin under $66,000 as traders await Alphabet earnings to gauge AI trade
- AI models escaped OpenAI’s sandbox and hit Hugging Face. Crypto is where that gets dangerous
- Bitcoin holds near $66,300 as chips extend their rally and the yen hits a 40-year low
- Crypto lobby group Digital Chamber sues Illinois to block digital asset tax
- Crypto Clarity Act still at mercy of ethics section as Democrats balk at Trump deal
- DAT Went Wrong: Satsuma to Unwind Bitcoin Treasury, Sell Off $43 Million in BTC
- OpenAI Models Escaped Locked Test Environment, Hacked Hugging Face to Cheat on Benchmark
🔍 Technical Analysis
Bitcoin (BTC) — -0.78%
$65,985.52 52W: $57,747.77 — $104,005.49
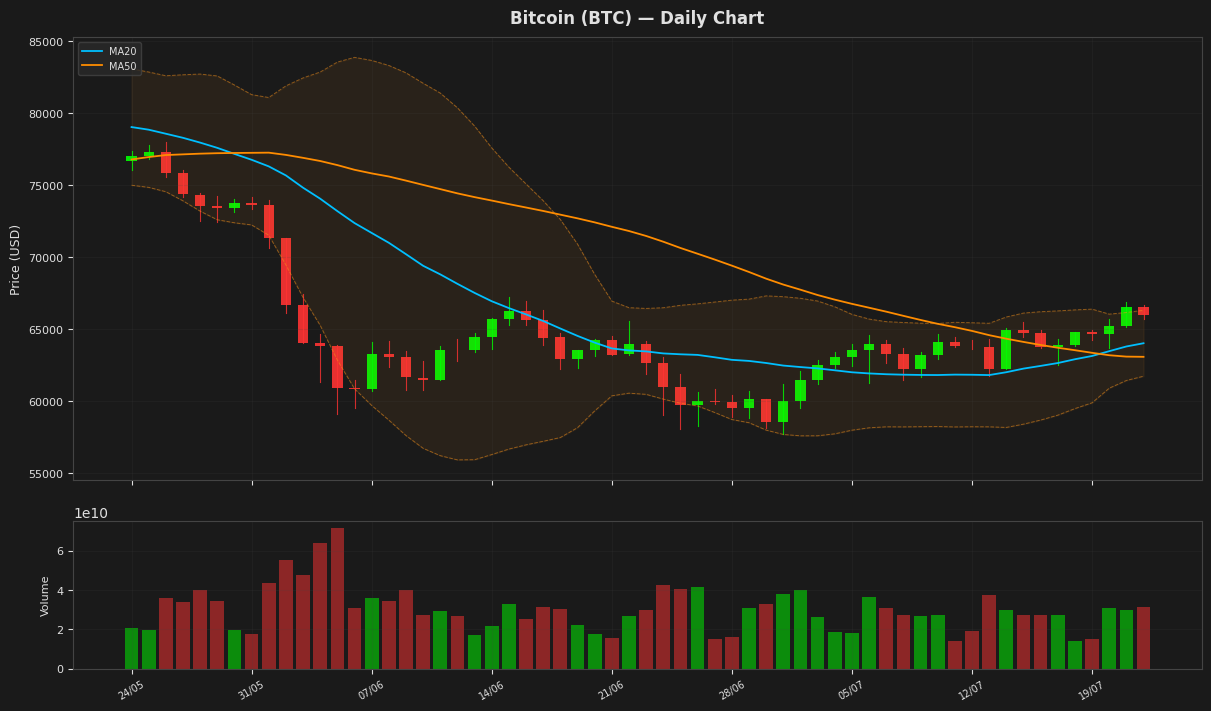
Bitcoin is currently trading at $65,985.52, slightly below its 20-day moving average of $64,020.77 is actually below the current price, indicating a relatively strong short-term trend. The RSI is at 66.81, suggesting the cryptocurrency is nearing overbought territory, while the MACD is above its signal line, indicating a bullish signal. The price is also within the Bollinger Bands, with the upper band at $66,308.51.
Ethereum (ETH) — -0.38%
$1,920.96 52W: $1,506.51 — $3,561.86
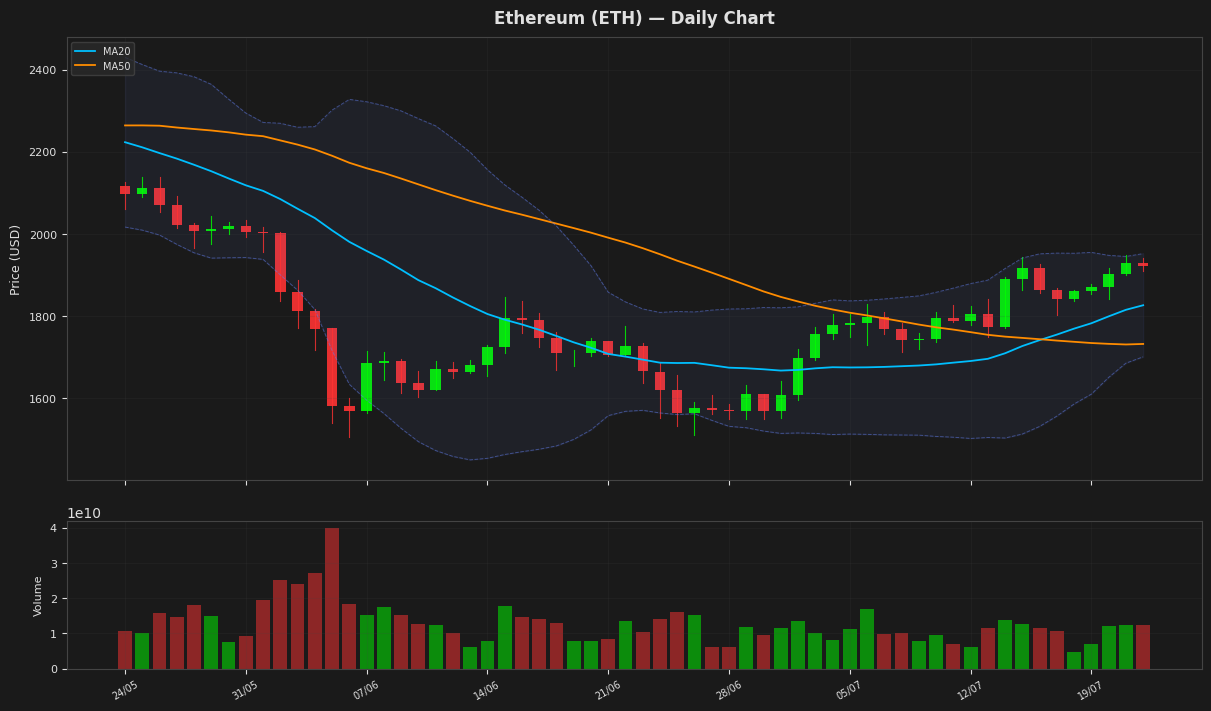
Ethereum's price is currently at $1,920.96, nearing the upper Bollinger Band at $1,952.13, indicating potential resistance. The RSI is at 70.98, suggesting the asset is overbought and may be due for a correction. The MACD is above its signal line, indicating a bullish signal, but the narrowing gap between the two may indicate a potential reversal. The ATR indicates high volatility, supporting the possibility of a significant price move.
Ripple (XRP) — -0.65%
$1.1350 52W: $1.0098 — $2.5200
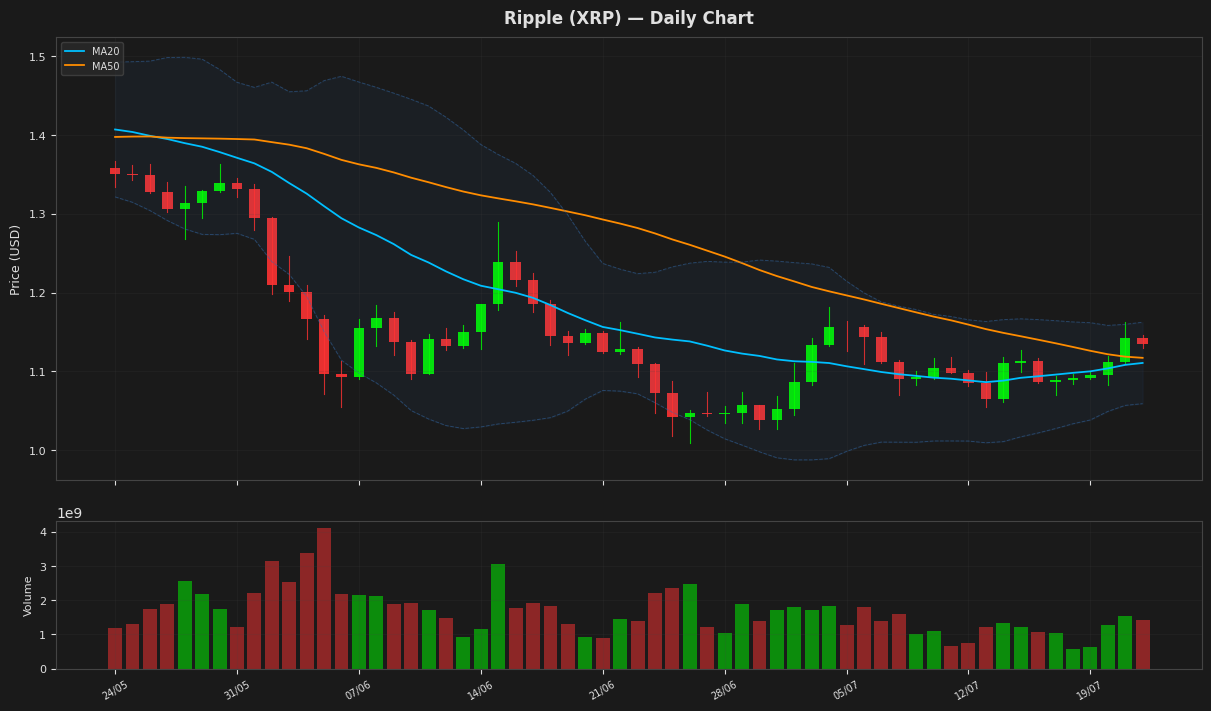
Ripple's price is currently at $1.135, slightly above both its 20-day and 50-day moving averages, indicating a neutral to slightly bullish trend. The Relative Strength Index is at 61.86, suggesting the asset is not overbought. The Bollinger Bands indicate that the price is near the upper band at $1.162, showing potential resistance. The MACD line is above its signal line, indicating a potential buy signal.
Solana (SOL) — -0.98%
$77.3400 52W: $60.4147 — $156.9861
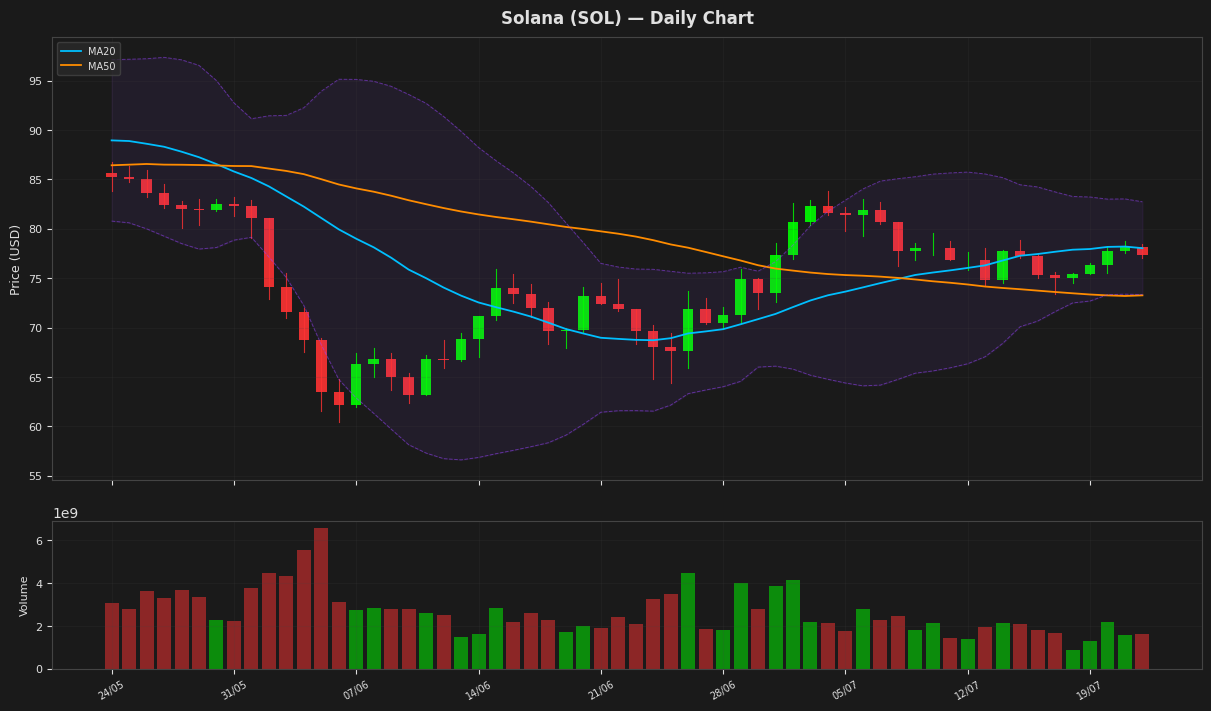
Solana's price is currently at $77.34, showing a minor decline of 0.98%. The RSI at 48.294 indicates a neutral stance, while the MACD at 0.464549 is below its signal line at 0.596647, suggesting a potential bearish crossover. The price is trading between the Bollinger Bands' lower and upper bounds, with the current price closer to the lower band at $73.339058, indicating a possible support level nearby.
BNB (BNB) — -0.74%
$569.3700 52W: $538.5992 — $969.8465
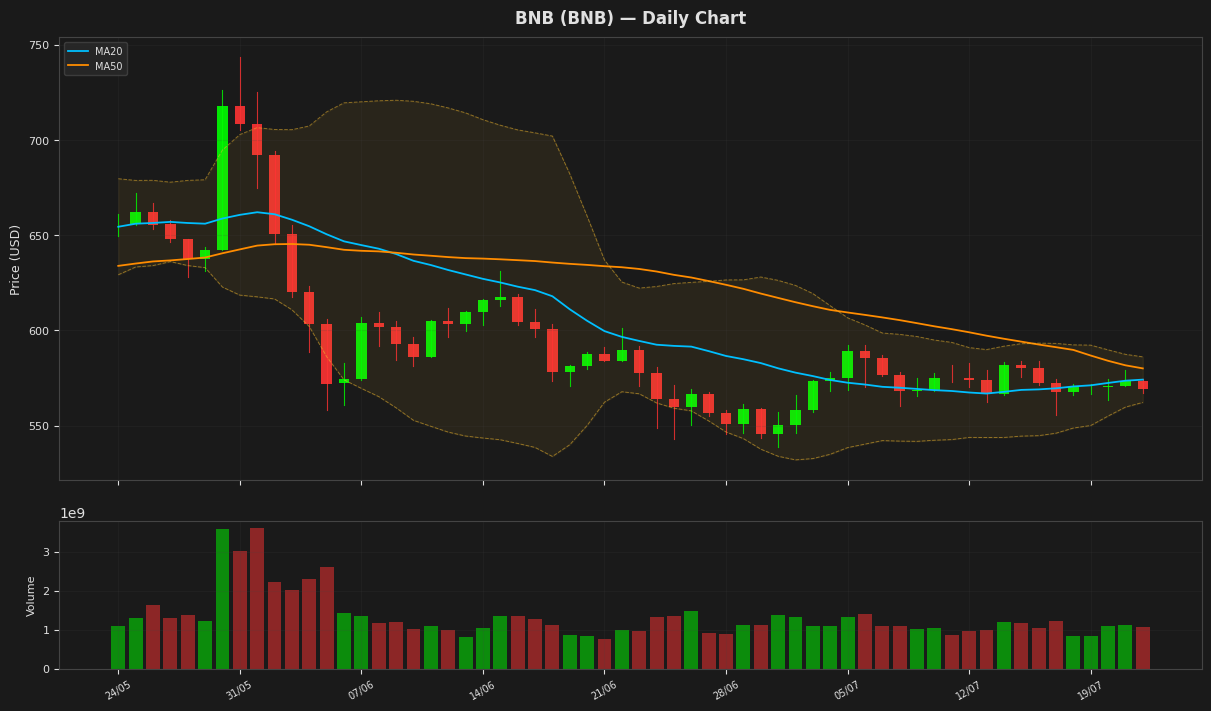
BNB is currently trading at $569.37, slightly below its MA20 and MA50, indicating a neutral to slightly bearish trend. The RSI is around 51, suggesting a balanced market with no clear dominance from either bulls or bears. The price is near the lower end of the Bollinger Bands, with the lower band at $562.19, indicating potential support. The MACD is below its signal line, suggesting a bearish signal.
Tron (TRX) — -0.14%
$0.328985 52W: $0.268138 — $0.376332
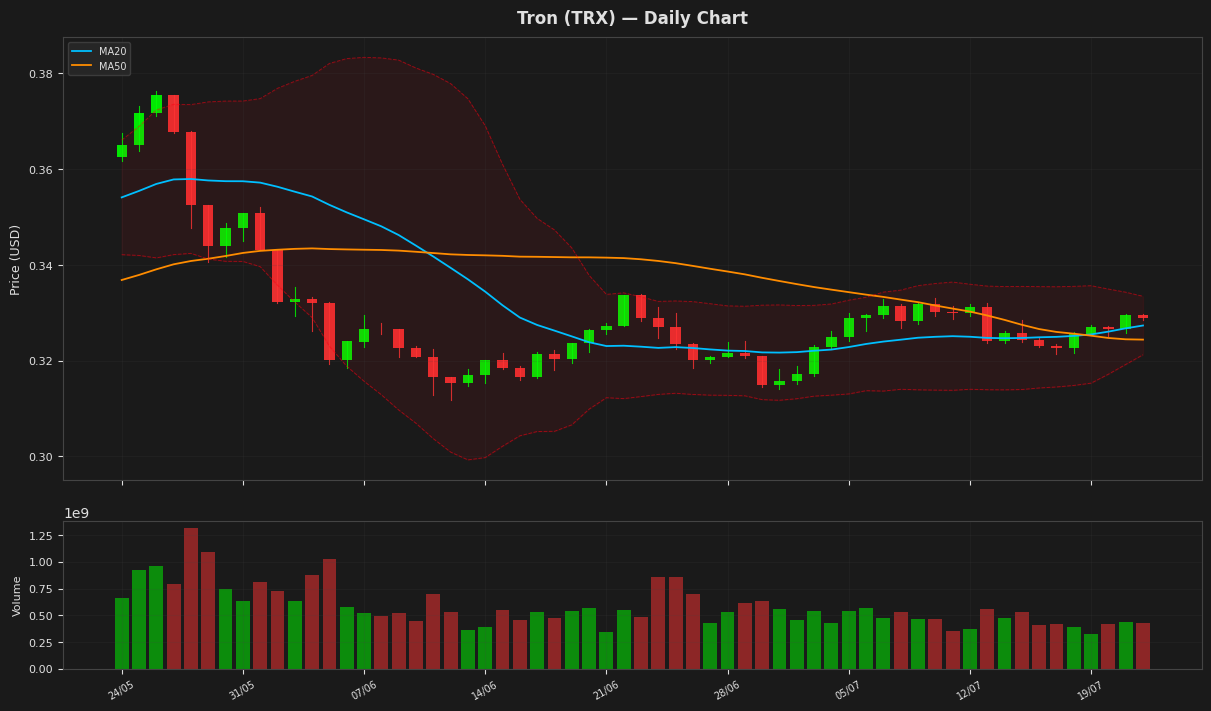
Tron's price is currently at $0.328985, showing a marginal decline of 0.14%. The RSI at 51.399191 indicates a neutral market sentiment, while the MACD is positive, suggesting a potential bullish crossover as it is above its signal line. The Bollinger Bands suggest that the price is near the upper band at 0.333441, indicating a possible resistance level.
Dogecoin (DOGE) — -1.22%
$0.072390 52W: $0.069611 — $0.176795
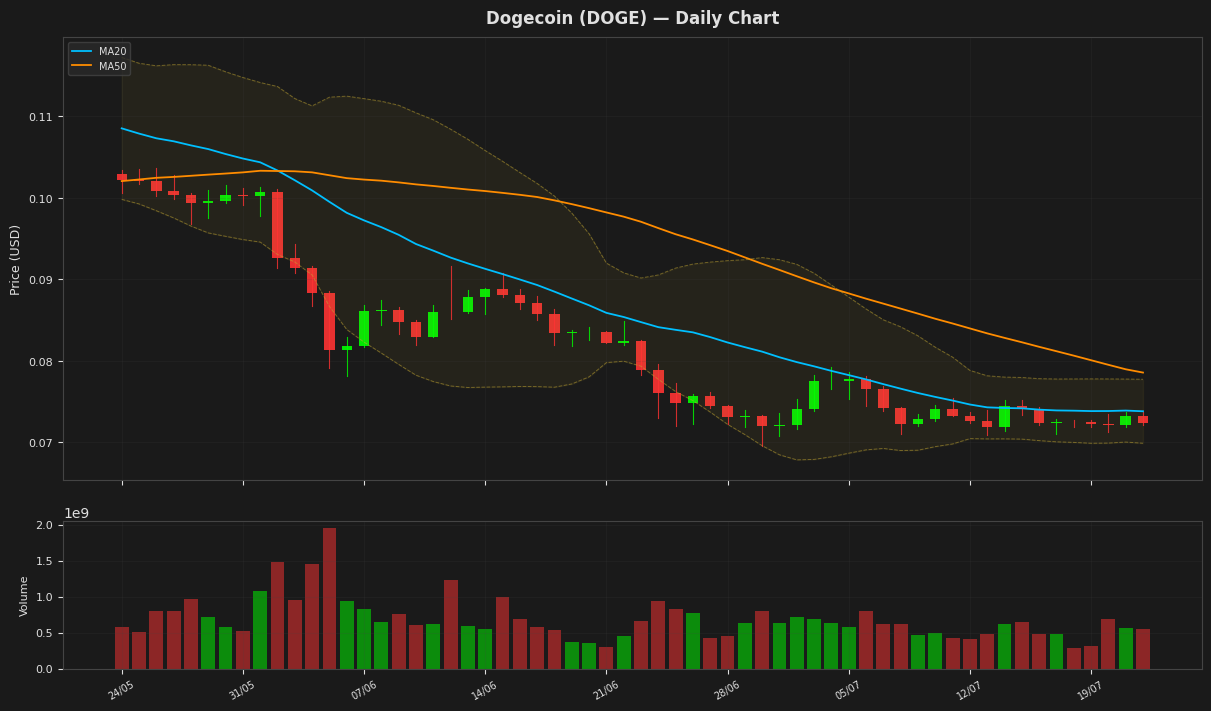
Dogecoin's price is currently at $0.072390, showing a slight decline, and is positioned between the Bollinger Band upper and lower limits, indicating a consolidating trend. The RSI is near 50, suggesting a neutral stance, while the MACD is below its signal line, indicating a bearish signal. The price is also below both the MA20 and MA50, further indicating a bearish trend. The ATR suggests relatively low volatility.
Disclaimer
The content on MarketsFN.com is provided for educational and informational purposes only. It does not constitute financial advice or investment recommendations. All investments involve risk. Past performance does not guarantee future results.