Crypto Market Update: Ethereum, Bitcoin, and Solana Experience Notable Declines
· Crypto · QuoteReporter
Crypto Market Update: Ethereum, Bitcoin, and Solana Experience Notable Declines
Crypto Market Report | July 31, 2026
📊 Crypto Market Overview
The cryptocurrency market is currently experiencing a slight downturn, with Bitcoin (BTC) trading at $63,841.25, down 1.37% today. Ethereum (ETH) follows closely at $1,888.92, reflecting a 1.48% decline. Overall market sentiment appears cautious, as many investors are assessing the implications of recent macroeconomic developments, including Japan's decision to maintain interest rates at 1%, which has kept the yen carry trade alive. This backdrop has contributed to a relatively stable Bitcoin price, which remains just below the $64,000 mark.
Key movers in the market include BNB, which has shown resilience with a minor decline of only 0.12%, maintaining a strong Relative Strength Index (RSI) of 69.3, indicating that it is nearing overbought territory. In contrast, Ripple (XRP) and Solana (SOL) are struggling, with XRP down 0.67% and SOL down 1.14%, both showing bearish momentum reflected in their respective RSI values of 47.0 and 45.3.
The recent inflow of $233 million into Bitcoin ETFs has provided a temporary boost to market confidence, pushing the week back into the green despite the current pullback. However, analysts from Wintermute caution that the upcoming altseason may yield fewer winners, suggesting a more selective environment for altcoins moving forward.
Technical indicators reveal mixed signals, with Bitcoin's RSI at 49.7, suggesting a neutral stance, while Ethereum's RSI at 56.0 indicates a slight bullish trend. The MACD readings for both Bitcoin and Ethereum are positive, yet the overall market still grapples with uncertainty amid external pressures. As the crypto landscape evolves, investors remain vigilant, balancing optimism with caution in a market characterized by volatility and rapid shifts in sentiment.
Key movers in the market include BNB, which has shown resilience with a minor decline of only 0.12%, maintaining a strong Relative Strength Index (RSI) of 69.3, indicating that it is nearing overbought territory. In contrast, Ripple (XRP) and Solana (SOL) are struggling, with XRP down 0.67% and SOL down 1.14%, both showing bearish momentum reflected in their respective RSI values of 47.0 and 45.3.
The recent inflow of $233 million into Bitcoin ETFs has provided a temporary boost to market confidence, pushing the week back into the green despite the current pullback. However, analysts from Wintermute caution that the upcoming altseason may yield fewer winners, suggesting a more selective environment for altcoins moving forward.
Technical indicators reveal mixed signals, with Bitcoin's RSI at 49.7, suggesting a neutral stance, while Ethereum's RSI at 56.0 indicates a slight bullish trend. The MACD readings for both Bitcoin and Ethereum are positive, yet the overall market still grapples with uncertainty amid external pressures. As the crypto landscape evolves, investors remain vigilant, balancing optimism with caution in a market characterized by volatility and rapid shifts in sentiment.
📰 Crypto News
- Bitcoin ETFs post $233M inflows, pushing week back into the green
- Crypto’s next altseason may have fewer winners: Wintermute
- Coldcard issues Mk3 warning as experts examine $38M Bitcoin wallet drain
- Bhutan’s Gelephu taps 3iQ to manage part of Bitcoin treasury
- US senators sent revised ethics rules to White House for CLARITY Act: Report
- Strategy posts $8.2B Q2 loss as Bitcoin slump drives unrealized losses
- World Cup generated $20B in blockchain prediction market volume: Chainalysis
- Coinbase Q2 profit misses estimates despite record crypto market share
- Live updates: Bitcoin steady as Japan holds rates at 1%, keeping the yen carry trade alive
- Bitcoin flat near $64,000 as Kospi's record 17% surge leaves crypto untouched
- Major bitcoin wallet flaw drains 594 BTC in 25-minute sweep
- Strategy books $8.2 billion Q2 loss on bitcoin price decline
- Coinbase Misses on Q2 Earnings as Crypto Trading Activity Slows
🔍 Technical Analysis
Bitcoin (BTC) — -1.37%
$63,841.25 52W: $57,747.77 — $97,860.60
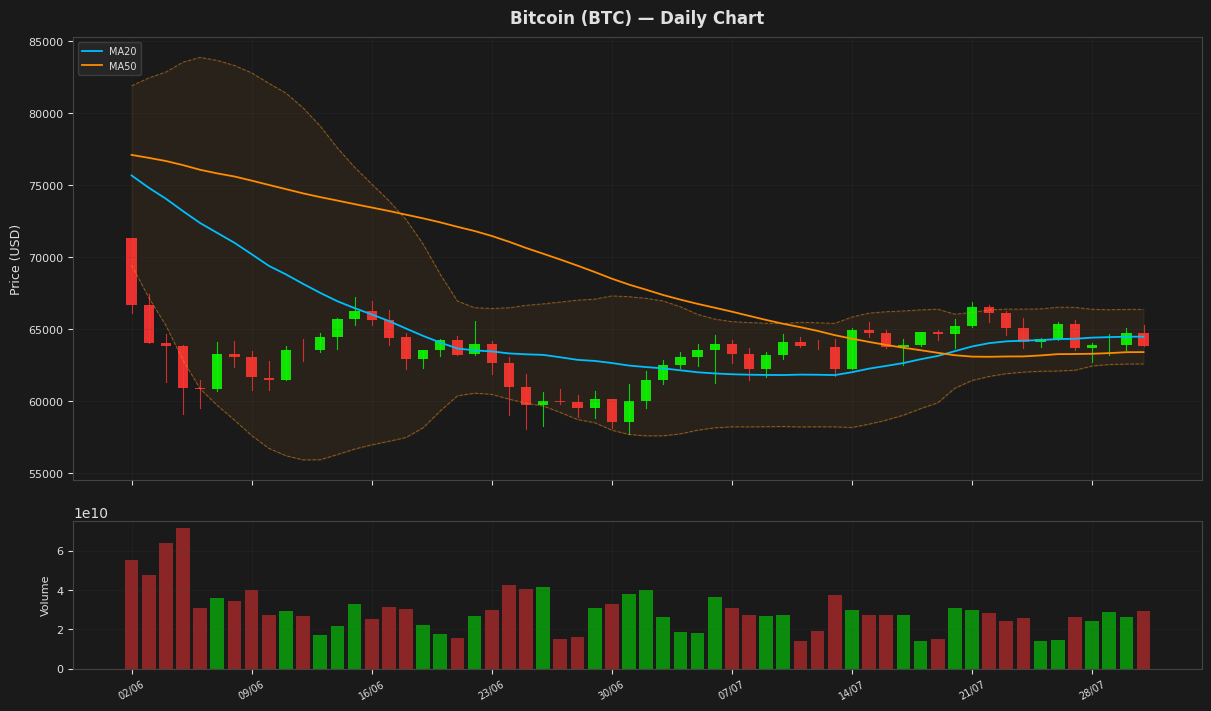
Bitcoin is currently trading at $63,841.25, reflecting a daily decline of 1.37%. The price is situated above the 20-day moving average (MA20) of $64,477.22 but slightly below the 50-day moving average (MA50) of $63,406.14, indicating a potential consolidation phase. The RSI at 49.71 suggests that Bitcoin is neither overbought nor oversold, while the MACD shows a bearish crossover, indicating weakening momentum. The price remains within the Bollinger Bands, with the upper band at $66,371.32 and the lower band at $62,583.11, suggesting limited volatility in the short term.
Ethereum (ETH) — -1.48%
$1,888.92 52W: $1,506.51 — $3,446.62
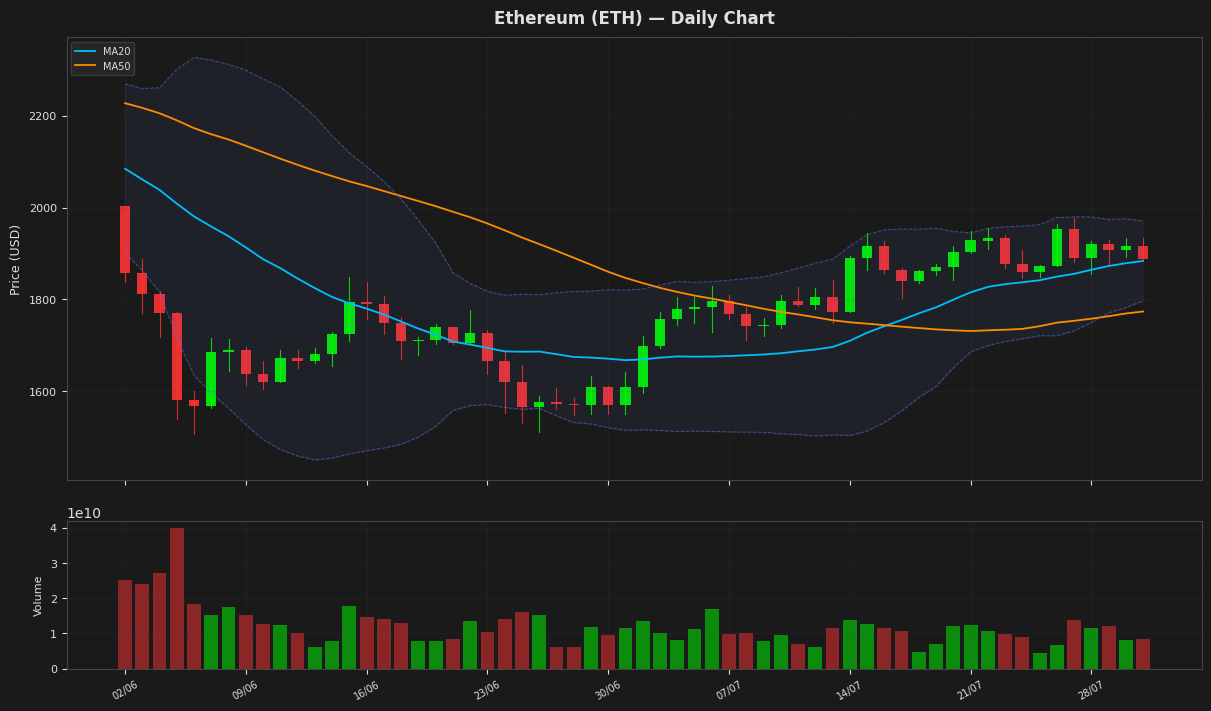
Ethereum is currently trading at $1,888.92, reflecting a daily decline of 1.48%. The price is above the 20-day moving average of $1,883.89, indicating short-term bullish momentum, while the 50-day moving average at $1,773.66 suggests a longer-term upward trend. The RSI is at 55.99, indicating neutral momentum, and the MACD shows a positive divergence, suggesting potential for upward movement. However, the price is approaching the lower Bollinger Band at $1,797.04, which could act as a support level if downward pressure continues.
Ripple (XRP) — -0.67%
$1.0766 52W: $1.0098 — $2.4103
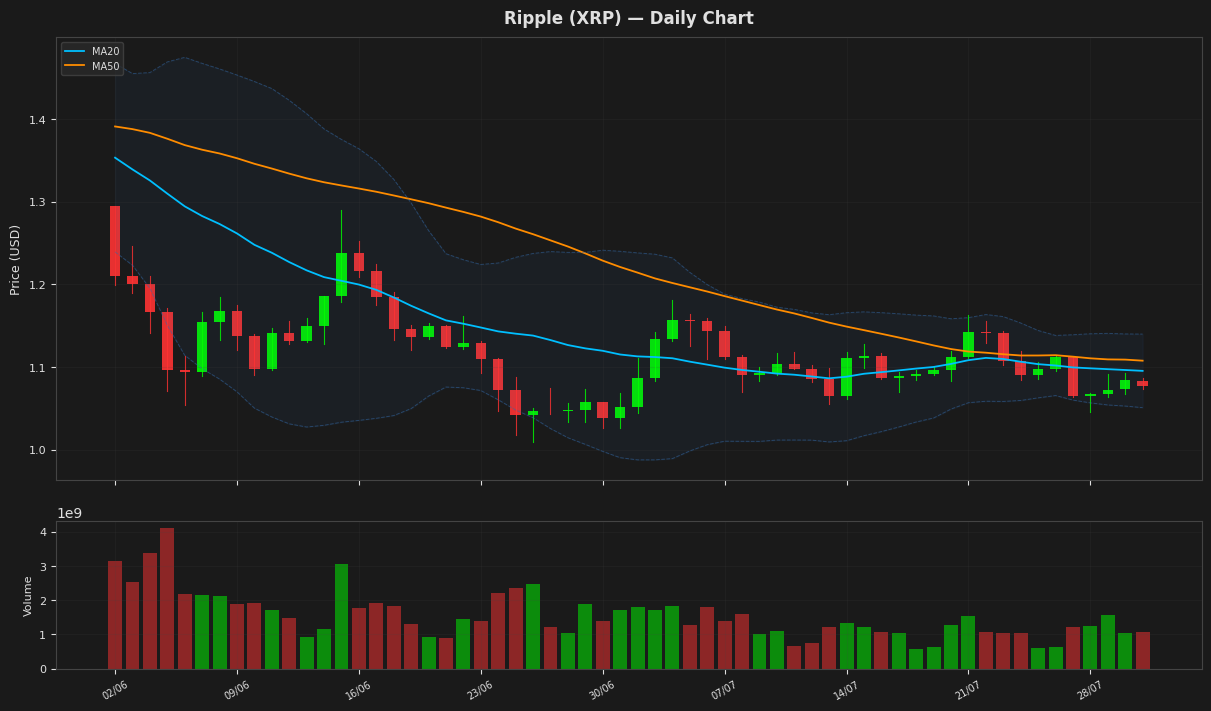
Ripple (XRP) is currently trading at $1.076600, reflecting a daily decline of 0.67%. The price is below both the 20-day moving average (MA20) of $1.095381 and the 50-day moving average (MA50) of $1.10769, indicating a bearish trend. The RSI is at 46.97, suggesting that XRP is nearing oversold conditions, while the MACD shows a slight negative momentum. The price is also hovering near the lower Bollinger Band at $1.050932, which could act as a support level.
Solana (SOL) — -1.14%
$73.6200 52W: $60.4147 — $148.2160
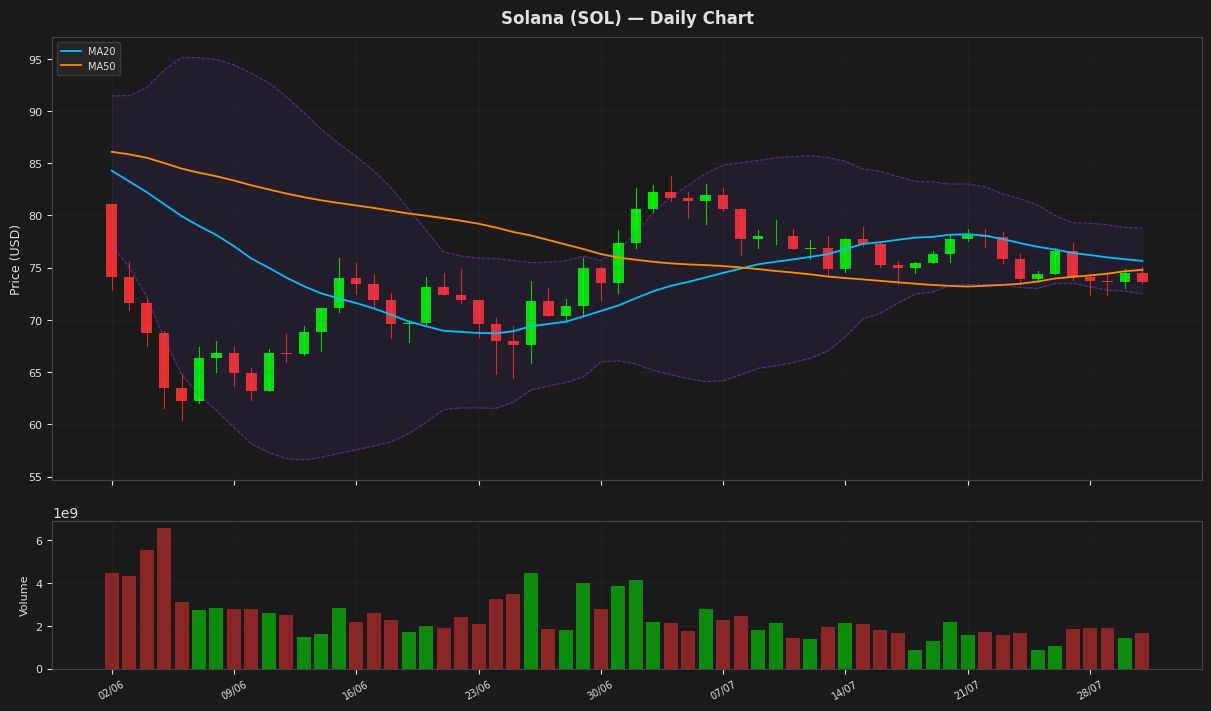
Solana is currently priced at $73.62, reflecting a daily decline of 1.14%. The price is trading below both the 20-day moving average (MA20) of $75.65 and the 50-day moving average (MA50) of $74.80, indicating a bearish trend. The Relative Strength Index (RSI) at 45.29 suggests that the asset is nearing oversold conditions, while the MACD shows a negative divergence, reinforcing the bearish sentiment. With the Bollinger Bands indicating a range between $72.49 and $78.81, Solana may face resistance at the upper band while finding support near the lower band.
BNB (BNB) — -0.12%
$591.3100 52W: $538.5992 — $954.8583
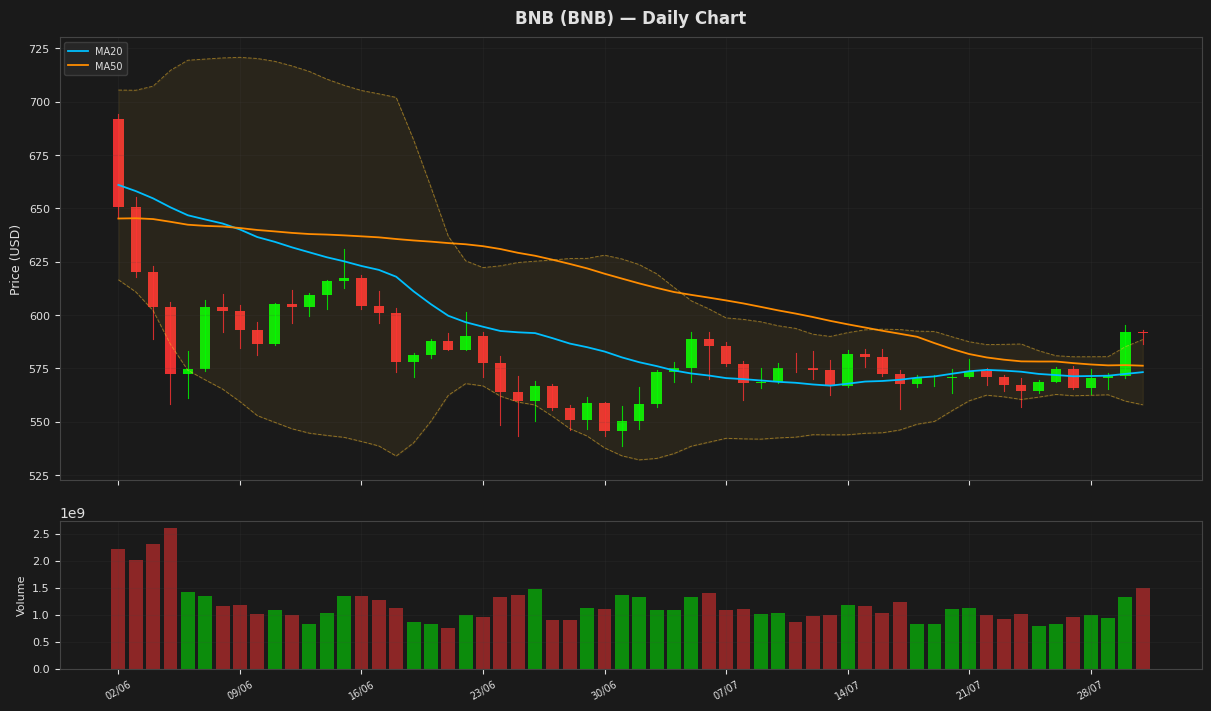
BNB is currently priced at $591.31, showing a slight daily decline of 0.12%. The price is above both the 20-day moving average (MA20) of $573.17 and the 50-day moving average (MA50) of $576.19, indicating a bullish trend. However, the RSI at 69.29 suggests that BNB is approaching overbought territory, while the MACD indicates a potential bearish divergence as the signal line is below the MACD line. The Bollinger Bands show the price is near the upper band at $588.48, which could act as resistance.
Tron (TRX) — +0.07%
$0.328561 52W: $0.268138 — $0.376332
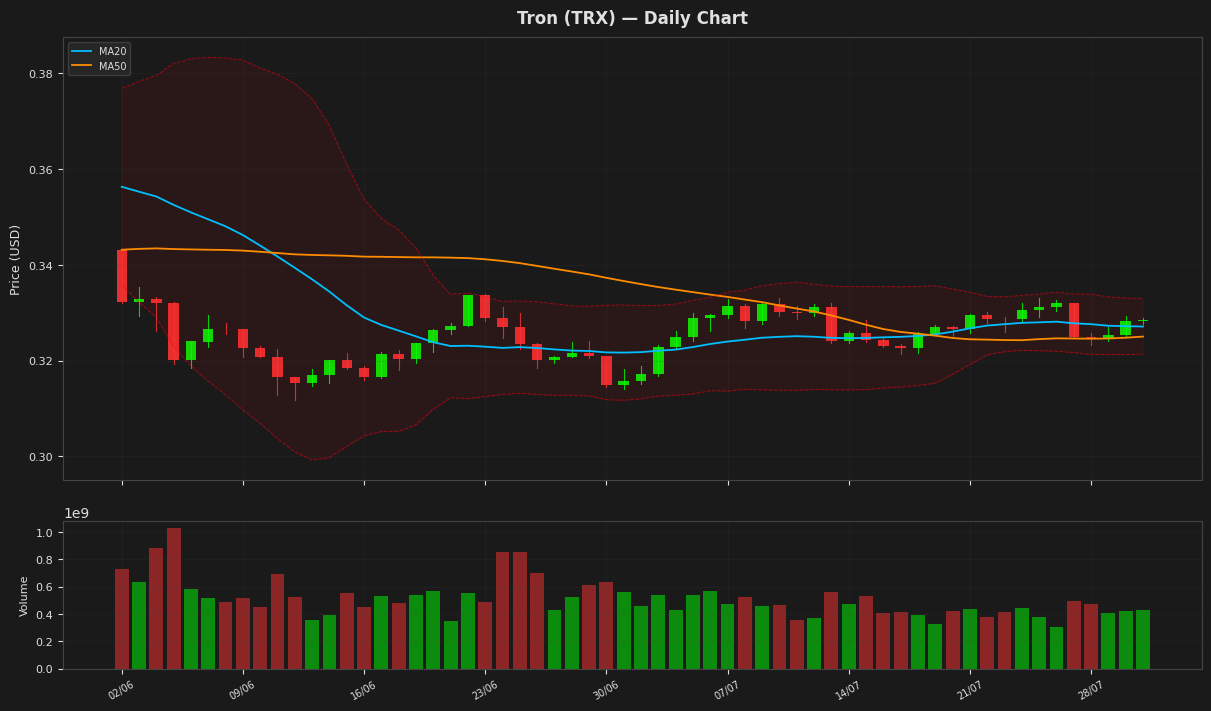
Tron (TRX) is currently priced at $0.328561, reflecting a slight daily increase of 0.07%. The price is above both the 20-day moving average (MA20) of 0.327129 and the 50-day moving average (MA50) of 0.325029, indicating a bullish trend. The RSI at 62.63 suggests that TRX is approaching overbought territory, while the MACD shows a slight positive momentum. The Bollinger Bands indicate that TRX is trading near the upper band at 0.332929, which could signal potential resistance ahead.
Dogecoin (DOGE) — -0.81%
$0.069980 52W: $0.068293 — $0.156602
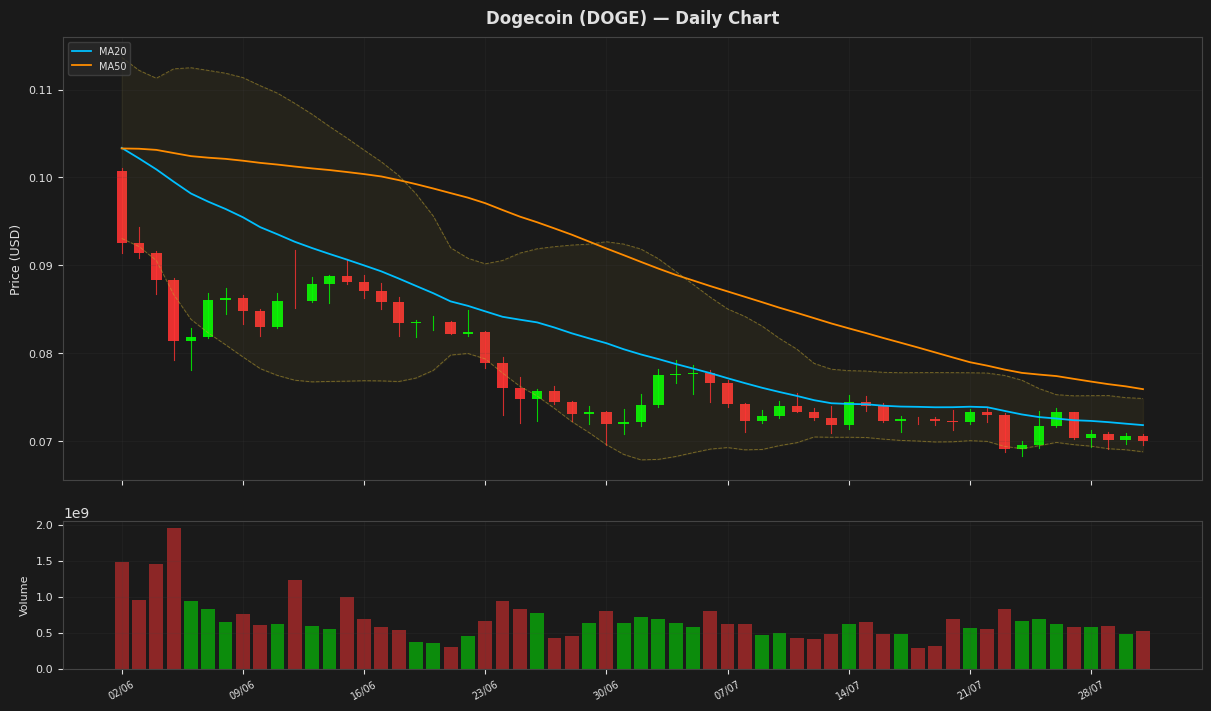
Dogecoin is currently trading at $0.069980, reflecting a daily decline of 0.81%. The price is below both the 20-day moving average (MA20) of $0.071817 and the 50-day moving average (MA50) of $0.07591, indicating a bearish trend. The RSI is at 41.53, suggesting that DOGE is approaching oversold conditions, while the MACD is negative, reinforcing the downward momentum. The price is near the lower Bollinger Band at $0.068787, which could act as a support level in the short term.
Disclaimer
The content on MarketsFN.com is provided for educational and informational purposes only. It does not constitute financial advice or investment recommendations. All investments involve risk. Past performance does not guarantee future results.