Crypto Market Update: Ripple and Solana Lead Gains, Tron Slips Back
· Crypto · QuoteReporter
Crypto Market Update: Ripple and Solana Lead Gains, Tron Slips Back
Crypto Market Report | June 09, 2026
📊 Crypto Market Overview
The cryptocurrency market is currently characterized by a subdued sentiment, with most major assets trading relatively flat. Bitcoin, the largest cryptocurrency by market capitalization, is trading at $63,269, showing a marginal increase of 0.05% over the past 24 hours. The RSI for Bitcoin stands at 14.2, indicating oversold conditions, while the MACD is negative at -4021.2645, suggesting a bearish trend.
Other major cryptocurrencies, such as Ethereum and Solana, are also trading with minimal changes, with Ethereum's RSI at 18.9 and Solana's at 19.1, both indicating oversold conditions. Ripple is one of the few assets showing some positivity, with a 1.52% gain over the past day. The MACD indicators for most of these assets are negative, reflecting the overall bearish sentiment in the market.
The macro context is influenced by recent news, including the UK financial regulator's proposal to allow retail funds to allocate up to 10% to cryptocurrencies. Meanwhile, a significant private key exploit resulted in an 85% drop in the Humanity Protocol token. The tokenized Real-World Assets (RWAs) sector has seen a substantial surge of almost 600% despite the overall crypto market pullback, according to Binance.
From a technical perspective, several major cryptocurrencies are exhibiting oversold conditions based on their RSI values. However, the MACD indicators suggest that the bearish trend persists. The market is currently awaiting catalysts that could potentially shift sentiment. The recent rebound in AI stocks has had a positive impact on certain cryptocurrencies, with BNB and SOL edging higher. Overall, the market remains cautious, with traders closely monitoring key support levels and potential triggers for a shift in sentiment.
📰 Crypto News
- UK financial regulator floats allowing 10% crypto allocations for retail funds
- Humanity Protocol token falls 85% amid $30M private key exploit
- OpenAI confidentially files to go public in the US
- Active tokenized RWAs surge almost 600% despite crypto pullback: Binance
- 'Best thesis' for Bitcoin accumulation surfaces despite current downside risk: Analyst
- Saylor blamed AI for bitcoin crash. Arca has one word for that: Nonsense
- Live markets: Bitcoin steady above $63,000, BNB, SOL edge higher as AI stocks rebound
- Chinese mining CEO says Strategy can survive a $30,000 bitcoin without selling
- Humanity Protocol token crashes more than 80% after a $32 million private-key hack
- Forehead tattoos and alcohol dares: Inside the dark underbelly of crypto's memecoin craze
- Influential research firm that caused AI stock meltdown lays out Hyperliquid as 'compelling' idea
- OpenAI Wants to Kill the Chatbot It Invented and Turn It Into a Superapp
- OpenAI Confirms Confidential IPO Filing, Keeps Timing Open
- China's Xiaomi MiMo Is Now 15X Faster Than ChatGPT and Claude
- Bored Ape Maker Yuga Labs Rescues Dozens of Ethereum NFTs From Exploit
🔍 Technical Analysis
Bitcoin (BTC) — +0.05%
$63,269.28 52W: $59,108.92 — $126,198.07
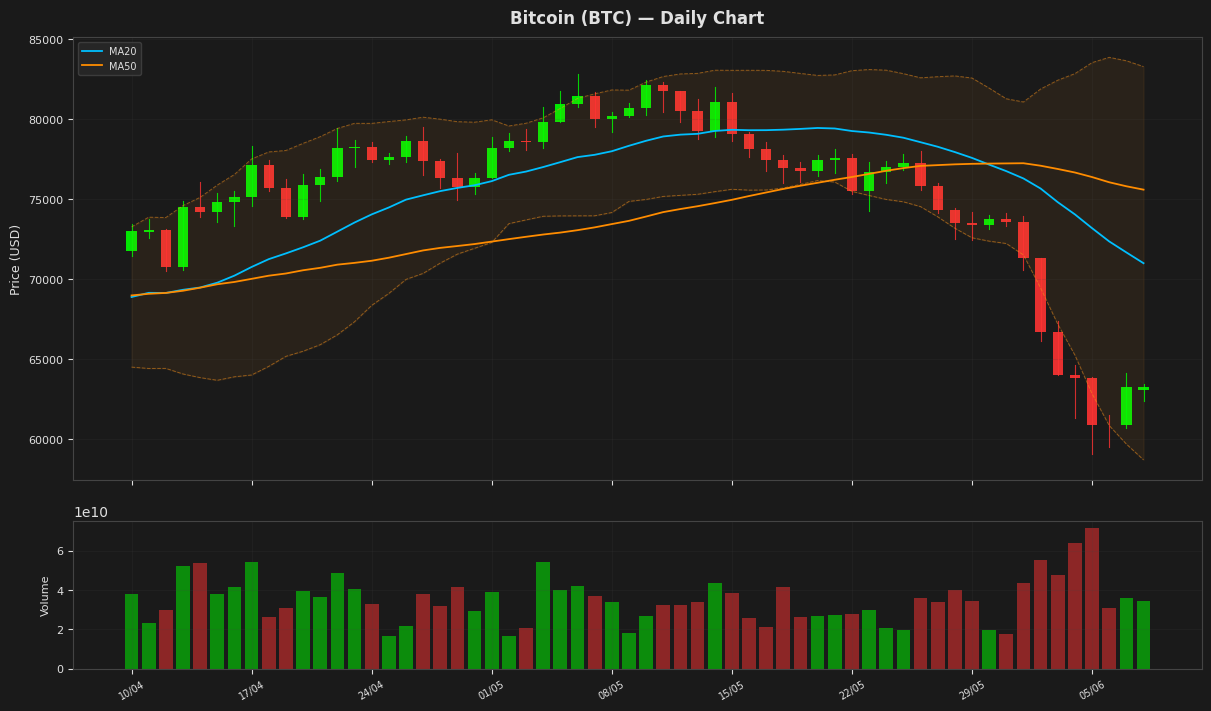
Bitcoin's price is currently at $63,269, showing a minimal daily change, and is positioned near the lower Bollinger Band at $58,719, indicating potential oversold conditions as supported by the RSI(14) value of 14.22. The MACD is below its signal line, suggesting a bearish trend. The Average True Range indicates high volatility, and the price is closer to the 52-week low than the high.
Ethereum (ETH) — +0.00%
$1,686.41 52W: $1,506.51 — $4,755.22
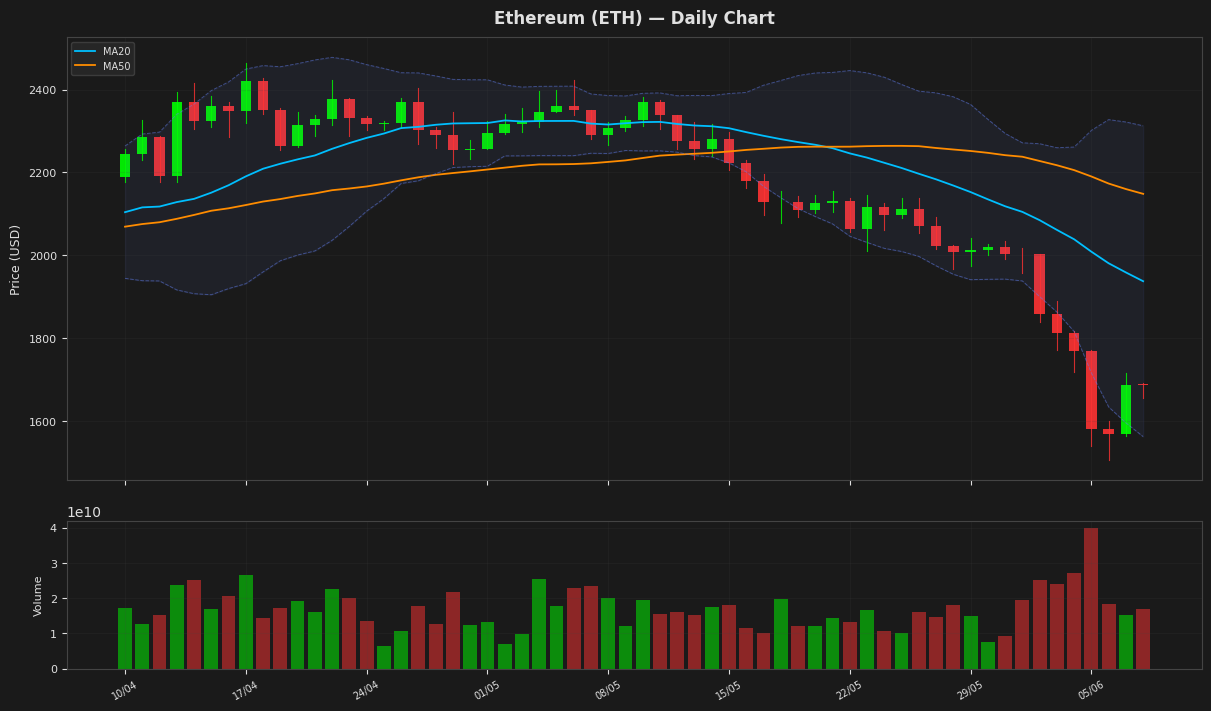
Ethereum's price is currently at $1,686.41, nearing the lower Bollinger Band at $1,562.45, and its RSI(14) value of 18.94 indicates oversold conditions. The MACD is below its signal line, suggesting a bearish trend. The price is also below both the MA20 and MA50, further indicating a downtrend. The ATR(14) suggests high volatility.
Ripple (XRP) — +1.52%
$1.1722 52W: $1.0547 — $3.0993
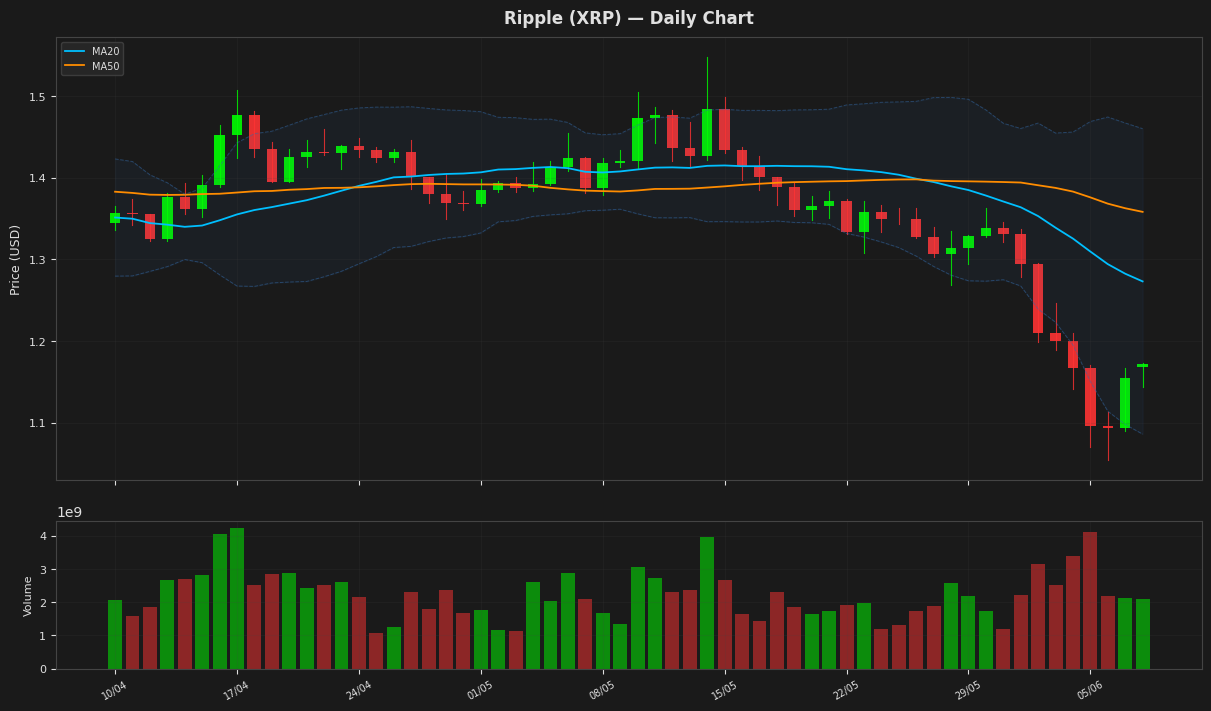
Ripple's price is currently at $1.172200, showing a daily gain of 1.52%, and is positioned near the lower end of its recent trading range, with the RSI indicating oversold conditions. The MACD is below its signal line, suggesting a bearish trend, while the price is above the lower Bollinger Band, indicating some support. The ATR suggests moderate volatility. Overall, the technical indicators present a mixed picture, with some signs of potential support but also ongoing bearish momentum.
Solana (SOL) — +1.19%
$67.1000 52W: $60.4147 — $237.3225
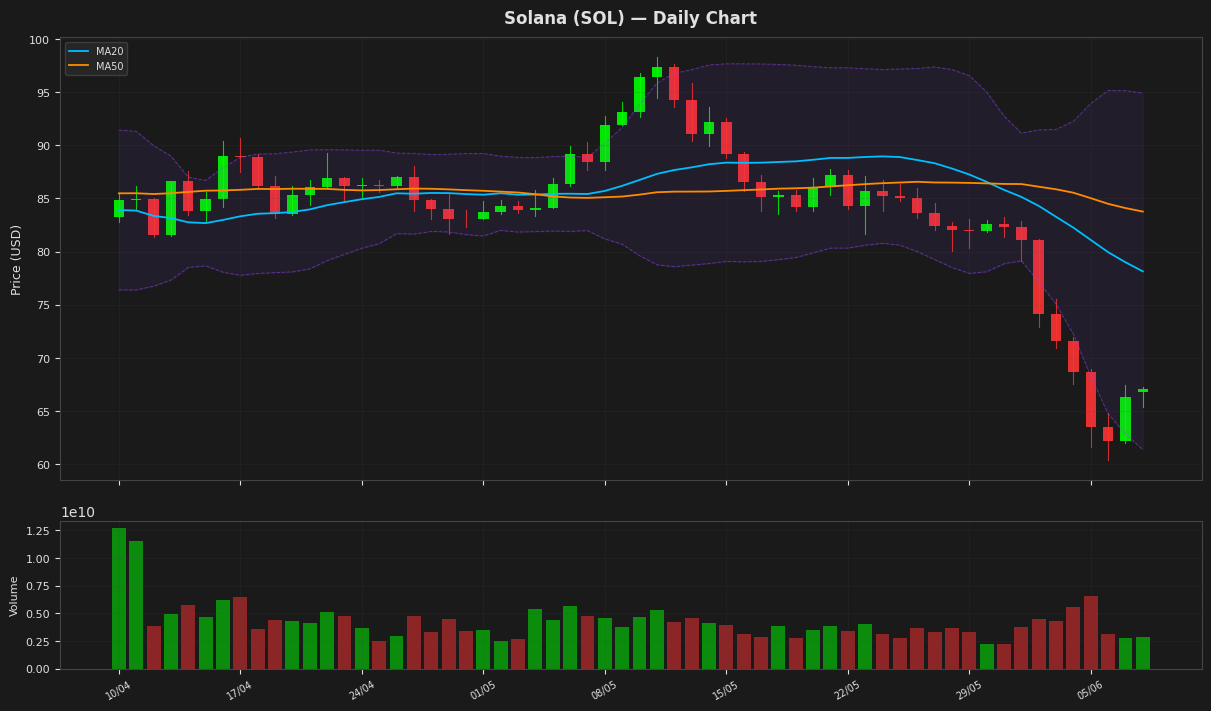
Solana's price is currently at $67.10, showing a slight increase of 1.19% daily, and is positioned near its 52-week low of $60.41. The RSI is at 19.08, indicating an oversold condition, while the MACD is negative and below its signal line, suggesting a bearish trend. The price is closer to the lower Bollinger Band at $61.37, indicating potential support. The ATR suggests moderate volatility.
BNB (BNB) — -0.18%
$602.5400 52W: $558.3898 — $1,370.55
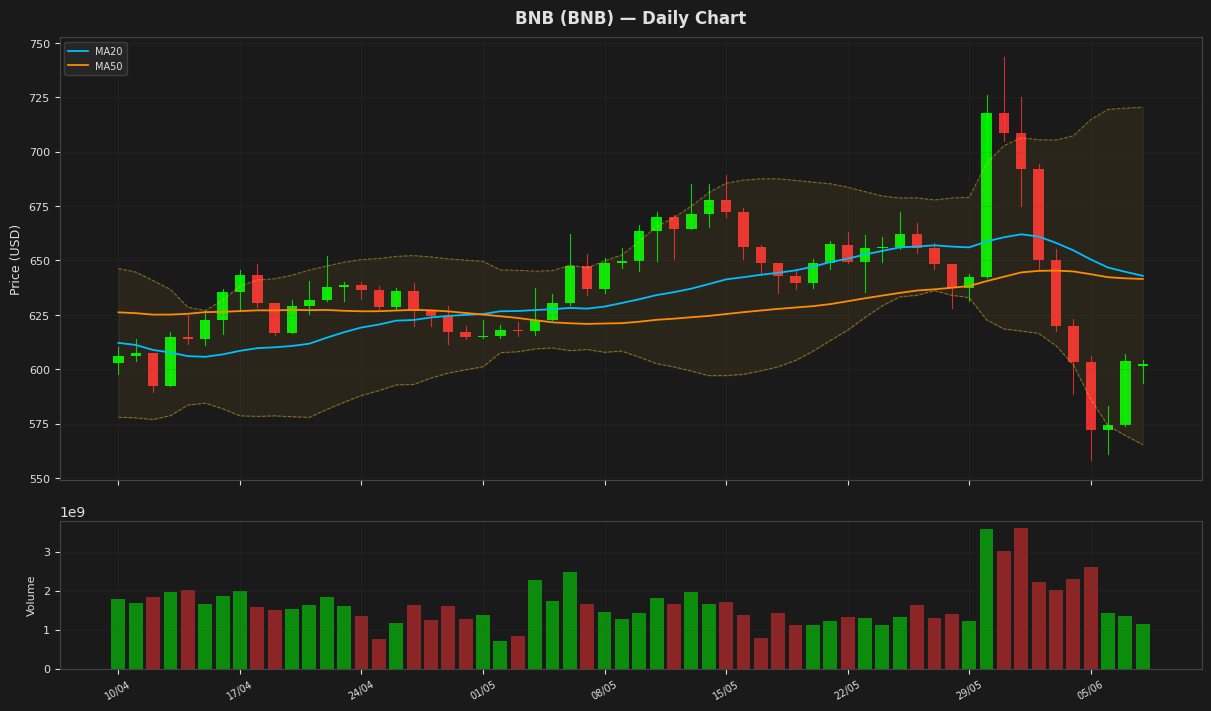
BNB is currently trading at $602.54, slightly above its 52-week low, with a relative strength index indicating oversold conditions as the RSI(14) stands at 39.47. The price is near the lower Bollinger Band at $565.38, suggesting potential support. The MACD is below its signal line, indicating a bearish trend, and the average true range suggests moderate volatility. The moving averages MA20 and MA50 are above the current price, indicating a downtrend.
Tron (TRX) — -0.55%
$0.324777 52W: $0.268138 — $0.376332
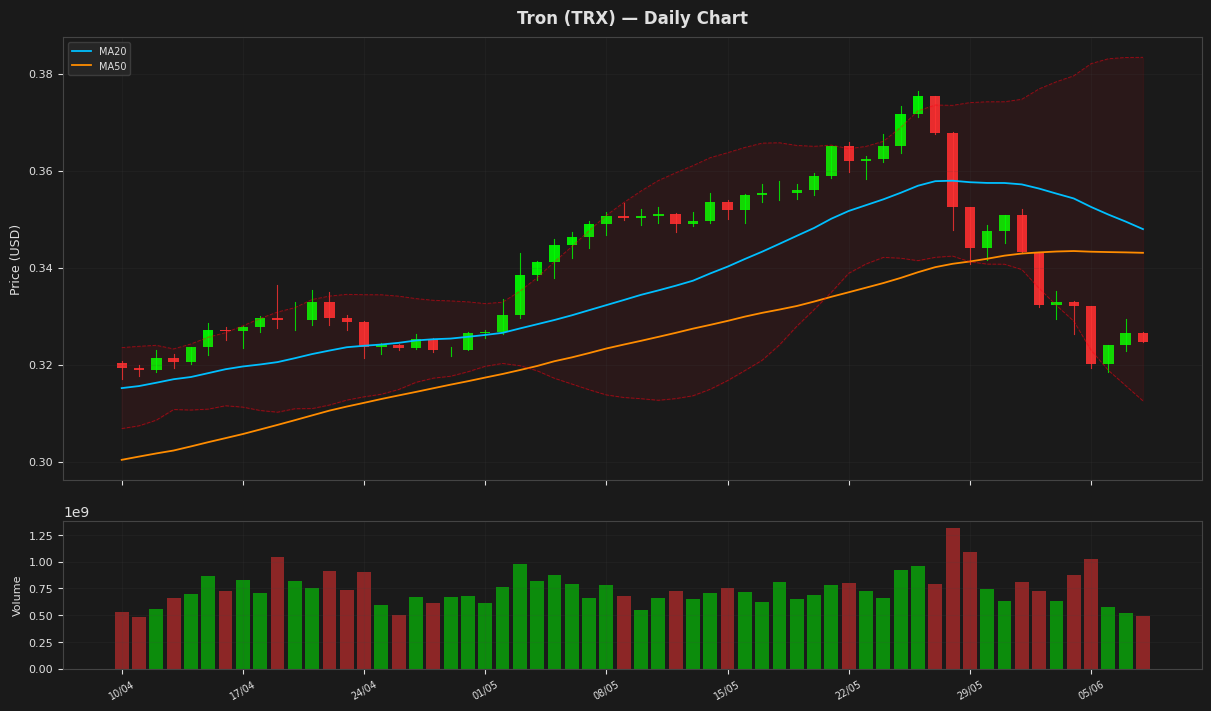
Tron's price is currently at $0.324777, showing a minor decline of 0.55% and hovering near the lower Bollinger Band at $0.312551, indicating potential oversold conditions. The RSI(14) value of 21.527563 further supports this, suggesting the asset may be undervalued. The MACD is below its signal line, indicating a bearish trend, but the low ATR(14) value of 0.00843 suggests relatively low volatility.
Dogecoin (DOGE) — +0.25%
$0.086300 52W: $0.078095 — $0.270047
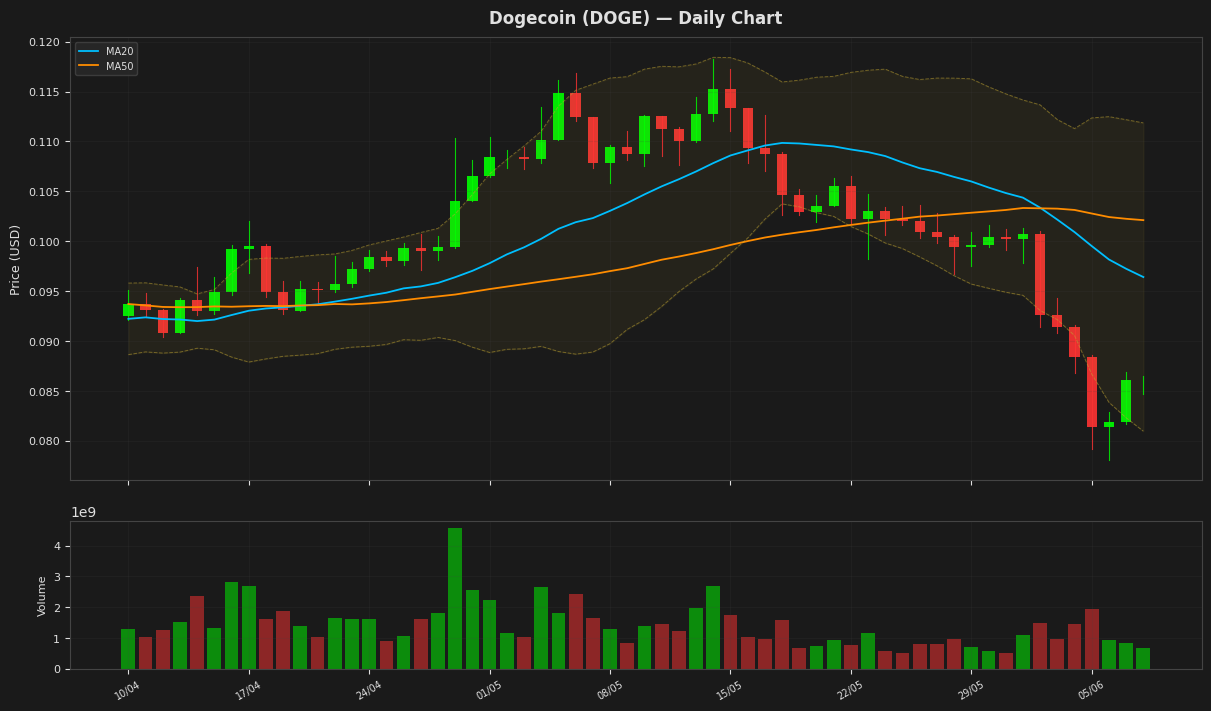
Dogecoin's price is currently at $0.086300, showing a minor daily gain, and is positioned near the lower Bollinger Band at $0.080964, indicating potential oversold conditions. The RSI(14) reading of 22.388011 further supports this, suggesting the cryptocurrency may be due for a rebound. The MACD is below the signal line, indicating a bearish trend, but the proximity to the lower Bollinger Band could limit further downside.
Disclaimer
The content on MarketsFN.com is provided for educational and informational purposes only. It does not constitute financial advice or investment recommendations. All investments involve risk. Past performance does not guarantee future results.