Dogecoin Slips to $0.0724 as RSI Nears Neutral Zone
· Crypto · QuoteReporter
Dogecoin Slips to $0.0724 as RSI Nears Neutral Zone
Dogecoin (DOGE/USD) | July 23, 2026 $0.0724 -0.70%
🔍 Technical Analysis
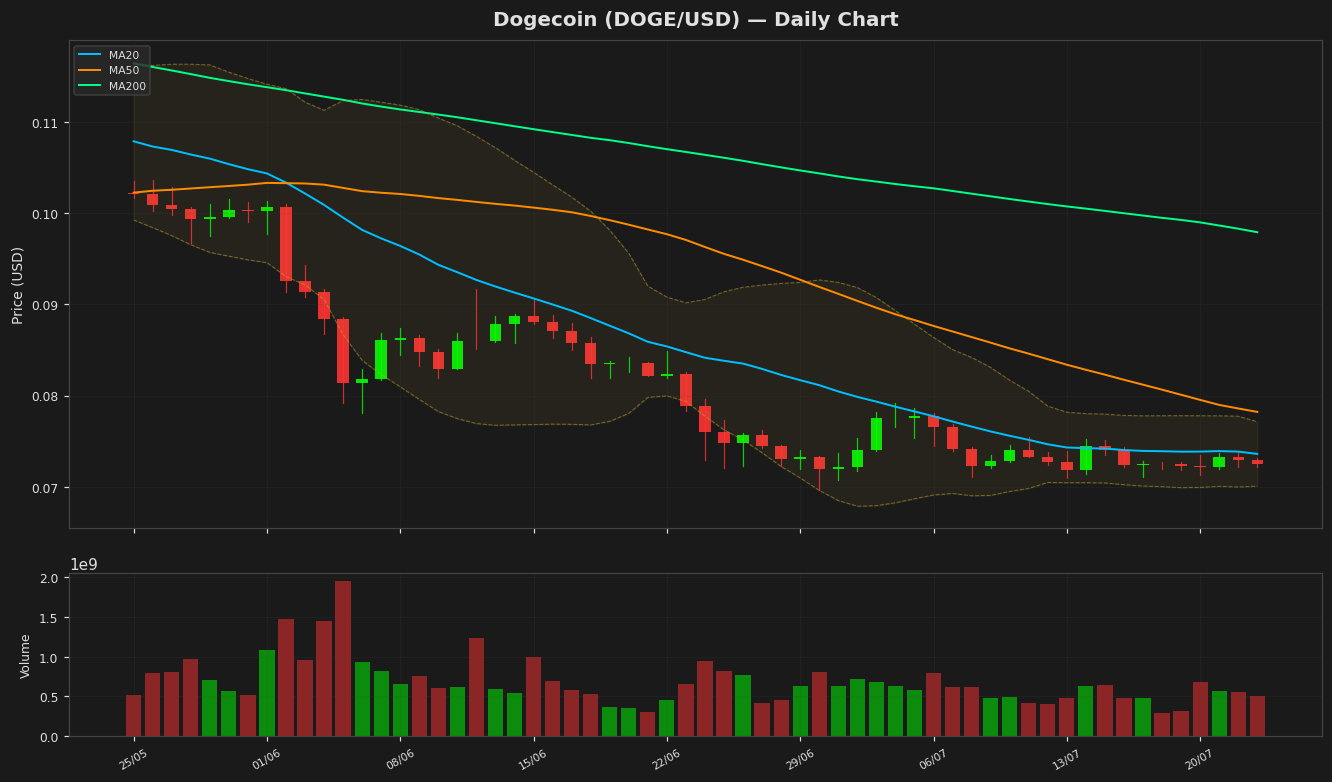
Dogecoin (DOGE) is currently trading at $0.072440, showing a slight daily decline of 0.70%. The price remains below key moving averages, indicating bearish momentum. The MA20 at $0.073602 and MA50 at $0.078206 both act as resistance levels, while the MA200 at $0.09792 underscores a longer-term downtrend. Bollinger Bands show a narrowing range, with the upper band at $0.077135 and the lower band at $0.070069, suggesting reduced volatility. The price hovering near the lower band signals potential oversold conditions. The RSI(14) at 48.023781 reflects neutral momentum, neither overbought nor oversold, while the MACD histogram at -0.001773 remains below its signal line (-0.002216), confirming bearish pressure. The ATR(14) at 0.00187 indicates low volatility, aligning with the tightening Bollinger Bands. Key support lies at the 52-week low of $0.069611, while resistance is seen at the MA20 ($0.073602) and the YTD high of $0.156091. A break below $0.070069 could trigger further downside, whereas a move above the MA20 may signal short-term recovery. The overall trend remains weak, with Dogecoin needing sustained buying volume to reverse the downtrend.
Technical Metrics
| Metric | Value |
|---|---|
| Current Price | $0.0724 |
| Daily Change | -0.70% |
| MA 20 | $0.0736 |
| % from MA20 | -1.58% |
| MA 50 | $0.0782 |
| % from MA50 | -7.37% |
| MA 200 | $0.0979 |
| % from MA200 | -26.02% |
| BB Upper | $0.0771 |
| % from BB Upper | -6.09% |
| BB Lower | $0.0701 |
| % from BB Lower | +3.38% |
| RSI (14) | 48.02 |
| MACD | -0.001773 |
| MACD Signal | -0.002216 |
| ATR (14) | 0.001870 |
| 3-Day High | $0.0738 |
| 3-Day Low | $0.0719 |
| 52-Week High | $0.1657 |
| % from 52W High | -56.29% |
| 52-Week Low | $0.0696 |
| % from 52W Low | +4.06% |
| YTD High | $0.1561 |
| % from YTD High | -53.59% |
| YTD Low | $0.0696 |
| % from YTD Low | +4.06% |
📊 Market Commentary
Dogecoin (DOGE) is trading at $0.0724, down 0.70% today, as the meme coin continues to hover near the lower end of its 52-week range ($0.0696 – $0.1657). The Relative Strength Index (RSI) at 48.0 suggests a neutral momentum, indicating neither overbought nor oversold conditions. Market sentiment remains cautious, with DOGE struggling to regain upward traction amid muted trading volumes and a lack of significant catalysts.
Key support levels to watch include the yearly low of $0.0696, which has held firm in recent weeks. A break below this level could signal further downside, potentially testing $0.0650. On the upside, resistance is seen near $0.0750, followed by the psychological $0.0800 mark, which has acted as a barrier in recent months. Traders are monitoring Bitcoin’s price action, as DOGE often correlates with broader market trends.
Whale activity and exchange flows are also in focus, with large transactions occasionally driving short-term volatility. Despite its meme origins, Dogecoin retains a dedicated community, but adoption news or social media hype would likely be needed to spur sustained momentum. For now, the market appears range-bound, with traders awaiting clearer signals before committing to larger positions. The neutral RSI and tight price action suggest consolidation may continue unless external factors shift sentiment.
Key support levels to watch include the yearly low of $0.0696, which has held firm in recent weeks. A break below this level could signal further downside, potentially testing $0.0650. On the upside, resistance is seen near $0.0750, followed by the psychological $0.0800 mark, which has acted as a barrier in recent months. Traders are monitoring Bitcoin’s price action, as DOGE often correlates with broader market trends.
Whale activity and exchange flows are also in focus, with large transactions occasionally driving short-term volatility. Despite its meme origins, Dogecoin retains a dedicated community, but adoption news or social media hype would likely be needed to spur sustained momentum. For now, the market appears range-bound, with traders awaiting clearer signals before committing to larger positions. The neutral RSI and tight price action suggest consolidation may continue unless external factors shift sentiment.
Disclaimer
The content on MarketsFN.com is provided for educational and informational purposes only. It does not constitute financial advice or investment recommendations. All investments involve risk. Cryptocurrency markets are highly volatile. Past performance does not guarantee future results.