Dogecoin Tests Key Support as RSI Nears Oversold Zone
· Crypto · QuoteReporter
Dogecoin Tests Key Support as RSI Nears Oversold Zone
Dogecoin (DOGE/USD) | July 07, 2026 $0.0749 -2.22%
🔍 Technical Analysis
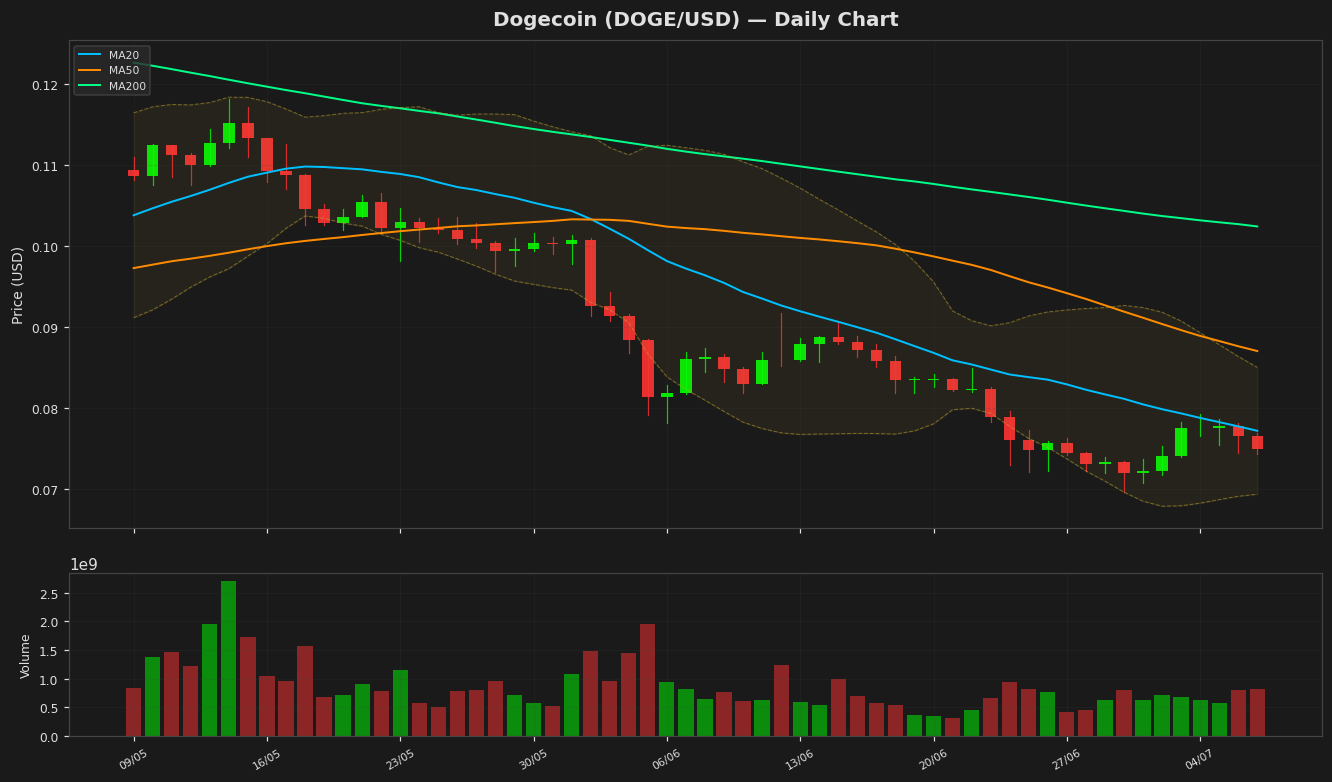
Dogecoin (DOGE) is currently trading at $0.074880, down 2.22% on the daily chart, reflecting bearish momentum. The price sits below all key moving averages, with the MA20 at $0.077188, MA50 at $0.087045, and MA200 at $0.102448, indicating a strong downtrend across short, medium, and long-term timeframes. The Bollinger Bands show a narrowing range, with the upper band at $0.085029 and the lower band at $0.069347, suggesting reduced volatility. The price is hovering near the lower band, which may act as temporary support. The RSI(14) at 38.731152 is approaching oversold territory but has not yet signaled a reversal. The MACD histogram is negative at -0.003244, with the signal line at -0.004027, confirming bearish momentum. Key support levels to watch are $0.069347 (Bollinger Lower Band) and the 52-week low of $0.069611. Resistance levels include the MA20 at $0.077188 and the upper Bollinger Band at $0.085029. The ATR(14) of $0.003476 indicates low volatility. Given the current technical setup, DOGE remains in a bearish phase unless it reclaims the MA20 and RSI crosses above 50. The 52-week high of $0.19727001 and YTD high of $0.156091 highlight the significant downside pressure.
Technical Metrics
| Metric | Value |
|---|---|
| Current Price | $0.0749 |
| Daily Change | -2.22% |
| MA 20 | $0.0772 |
| % from MA20 | -2.99% |
| MA 50 | $0.0870 |
| % from MA50 | -13.98% |
| MA 200 | $0.1024 |
| % from MA200 | -26.91% |
| BB Upper | $0.0850 |
| % from BB Upper | -11.94% |
| BB Lower | $0.0693 |
| % from BB Lower | +7.98% |
| RSI (14) | 38.73 |
| MACD | -0.003244 |
| MACD Signal | -0.004027 |
| ATR (14) | 0.003476 |
| 3-Day High | $0.0786 |
| 3-Day Low | $0.0743 |
| 52-Week High | $0.1973 |
| % from 52W High | -62.04% |
| 52-Week Low | $0.0696 |
| % from 52W Low | +7.57% |
| YTD High | $0.1561 |
| % from YTD High | -52.03% |
| YTD Low | $0.0696 |
| % from YTD Low | +7.57% |
📊 Market Commentary
Dogecoin (DOGE) is currently trading at $0.0749, down 2.22% today, as the broader cryptocurrency market shows mixed sentiment. The Relative Strength Index (RSI) at 38.7 suggests DOGE is approaching oversold territory but has not yet entered it, indicating potential for further downside or consolidation before a possible rebound. Over the past 52 weeks, DOGE has fluctuated between $0.0696 and $0.1973, with the current price hovering near the lower end of this range.
Market sentiment for DOGE remains cautious, influenced by Bitcoin’s recent volatility and a lack of strong bullish catalysts for meme coins. Traders are closely watching the $0.0696 support level, which has held as a critical floor over the past year. A break below this level could signal further bearish momentum, while holding above it may encourage accumulation. On the upside, resistance is seen near $0.0800, a psychological level that has acted as a barrier in recent weeks.
Volume trends and broader crypto market movements remain key drivers for DOGE, as the coin often mirrors Bitcoin’s price action. Additionally, social media activity and whale movements are being monitored, given DOGE’s history of retail-driven rallies. For now, traders appear to be waiting for clearer signals before taking significant positions, with the RSI suggesting the market is neither overbought nor oversold. The coming days will likely hinge on whether DOGE can defend its yearly lows or faces renewed selling pressure.
Market sentiment for DOGE remains cautious, influenced by Bitcoin’s recent volatility and a lack of strong bullish catalysts for meme coins. Traders are closely watching the $0.0696 support level, which has held as a critical floor over the past year. A break below this level could signal further bearish momentum, while holding above it may encourage accumulation. On the upside, resistance is seen near $0.0800, a psychological level that has acted as a barrier in recent weeks.
Volume trends and broader crypto market movements remain key drivers for DOGE, as the coin often mirrors Bitcoin’s price action. Additionally, social media activity and whale movements are being monitored, given DOGE’s history of retail-driven rallies. For now, traders appear to be waiting for clearer signals before taking significant positions, with the RSI suggesting the market is neither overbought nor oversold. The coming days will likely hinge on whether DOGE can defend its yearly lows or faces renewed selling pressure.
Disclaimer
The content on MarketsFN.com is provided for educational and informational purposes only. It does not constitute financial advice or investment recommendations. All investments involve risk. Cryptocurrency markets are highly volatile. Past performance does not guarantee future results.