Ethereum Holds at $1,919 as RSI Nears Overbought Zone
· Crypto · QuoteReporter
Ethereum Holds at $1,919 as RSI Nears Overbought Zone
Ethereum (ETH/USD) | July 22, 2026 $1,919.5000 -0.46%
🔍 Technical Analysis
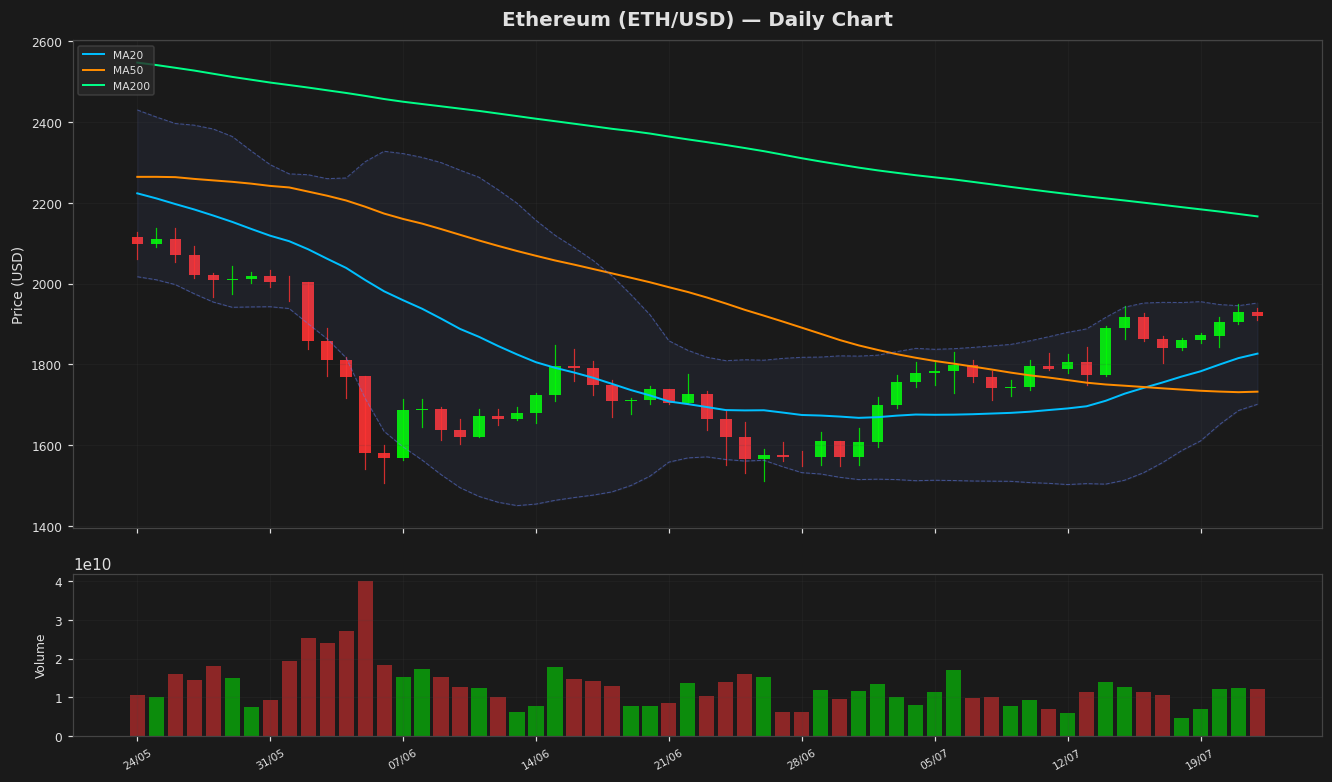
Ethereum (ETH) is currently trading at $1,919.50, showing a slight daily decline of 0.46%. The price remains above key moving averages, with the MA20 at $1,826.50 and MA50 at $1,732.35, indicating a bullish short-to-medium-term trend. However, the MA200 at $2,166.15 suggests resistance overhead, highlighting the broader bearish sentiment in the higher timeframe. The Bollinger Bands show the upper band at $1,951.82 and the lower band at $1,701.18, with ETH trading near the upper band, signaling potential overbought conditions. The RSI(14) at 70.74 confirms this, as it sits in overbought territory, suggesting a possible pullback or consolidation. The MACD supports bullish momentum, with the histogram at 47.45 above the signal line at 35.08, though divergence should be monitored for weakening momentum. Key support levels lie at $1,826 (MA20) and $1,732 (MA50), while resistance is seen at $1,951 (upper Bollinger Band) and $2,166 (MA200). The ATR(14) at 59.76 indicates moderate volatility. ETH remains below its 52-week high of $3,561.86 and YTD high of $3,397.90, reflecting a significant recovery needed to reclaim previous highs. Traders should watch for a break above $1,951 or a reversal below $1,826 for directional cues.
Technical Metrics
| Metric | Value |
|---|---|
| Current Price | $1,919.5000 |
| Daily Change | -0.46% |
| MA 20 | $1,826.5018 |
| % from MA20 | +5.09% |
| MA 50 | $1,732.3484 |
| % from MA50 | +10.80% |
| MA 200 | $2,166.1472 |
| % from MA200 | -11.39% |
| BB Upper | $1,951.8226 |
| % from BB Upper | -1.66% |
| BB Lower | $1,701.1809 |
| % from BB Lower | +12.83% |
| RSI (14) | 70.74 |
| MACD | 47.446699 |
| MACD Signal | 35.077647 |
| ATR (14) | 59.758179 |
| 3-Day High | $1,949.5477 |
| 3-Day Low | $1,842.8157 |
| 52-Week High | $3,561.8608 |
| % from 52W High | -46.11% |
| 52-Week Low | $1,506.5057 |
| % from 52W Low | +27.41% |
| YTD High | $3,397.8977 |
| % from YTD High | -43.51% |
| YTD Low | $1,506.5057 |
| % from YTD Low | +27.41% |
📊 Market Commentary
Ethereum (ETH) is currently trading at $1,919.50, down 0.46% today, as the market shows signs of consolidation after recent gains. The Relative Strength Index (RSI) sits at 70.7, indicating ETH is approaching overbought territory, which could prompt short-term profit-taking. Over the past 52 weeks, ETH has ranged between $1,506.51 and $3,561.86, reflecting significant volatility but also resilience above the $1,500 support level.
Market sentiment remains cautiously optimistic, with traders closely monitoring Ethereum’s ability to hold above the psychological $1,900 level. A sustained break below this zone could see a retest of the $1,800 support, while holding above $1,900 may reinforce bullish momentum. The $2,000 resistance remains a key level to watch, as a decisive breakout could attract further buying interest.
Traders are also paying attention to broader market trends, including Bitcoin’s price action and macroeconomic factors influencing risk assets. Ethereum’s network activity, including gas fees and decentralized application (dApp) usage, continues to be a focal point for assessing underlying demand. With the RSI nearing overbought conditions, short-term pullbacks are possible, but ETH’s longer-term trajectory will depend on its ability to maintain key support levels amid fluctuating market conditions.
Market sentiment remains cautiously optimistic, with traders closely monitoring Ethereum’s ability to hold above the psychological $1,900 level. A sustained break below this zone could see a retest of the $1,800 support, while holding above $1,900 may reinforce bullish momentum. The $2,000 resistance remains a key level to watch, as a decisive breakout could attract further buying interest.
Traders are also paying attention to broader market trends, including Bitcoin’s price action and macroeconomic factors influencing risk assets. Ethereum’s network activity, including gas fees and decentralized application (dApp) usage, continues to be a focal point for assessing underlying demand. With the RSI nearing overbought conditions, short-term pullbacks are possible, but ETH’s longer-term trajectory will depend on its ability to maintain key support levels amid fluctuating market conditions.
Disclaimer
The content on MarketsFN.com is provided for educational and informational purposes only. It does not constitute financial advice or investment recommendations. All investments involve risk. Cryptocurrency markets are highly volatile. Past performance does not guarantee future results.