Ethereum Nears Overbought at $1,753 as Bulls Push Higher
· Crypto · QuoteReporter
Ethereum Nears Overbought at $1,753 as Bulls Push Higher
Ethereum (ETH/USD) | July 09, 2026 $1,752.8600 +0.58%
🔍 Technical Analysis
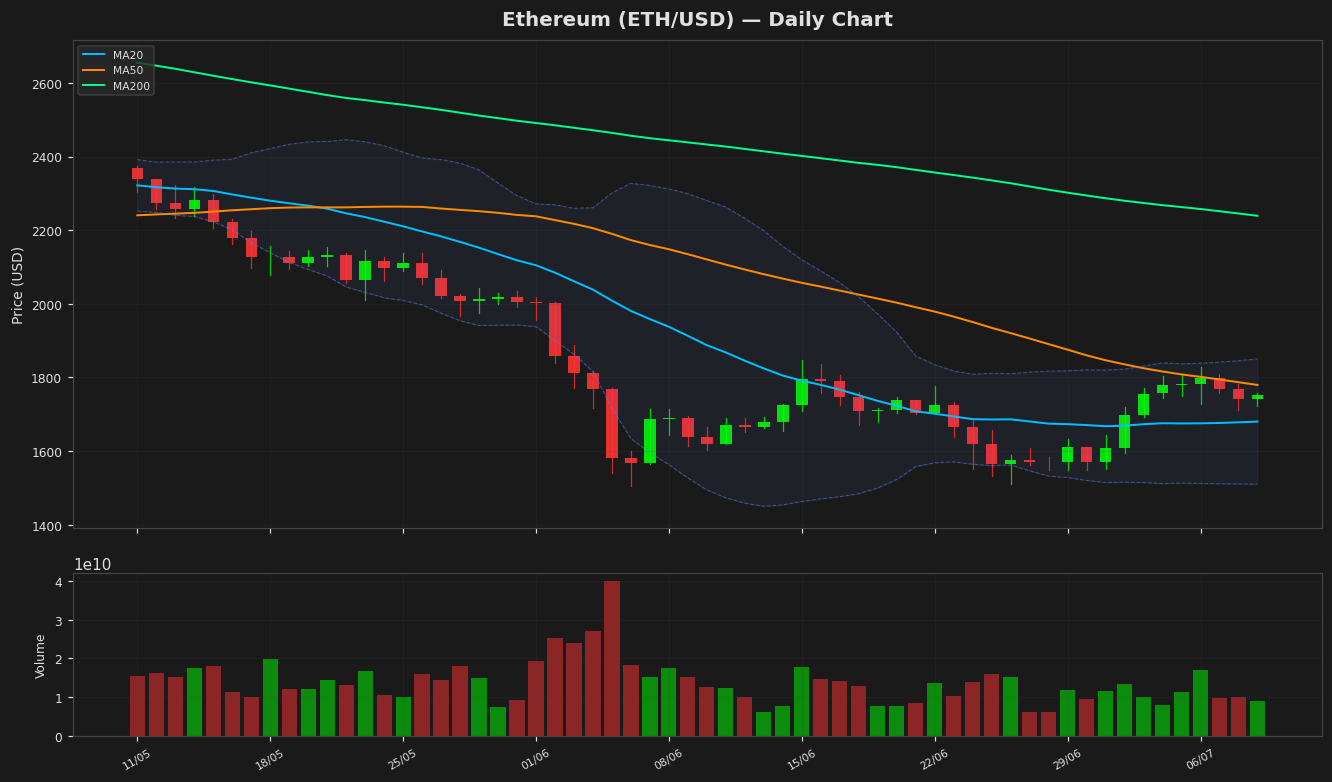
Ethereum (ETH) is currently trading at $1,752.86, showing a modest daily gain of 0.58%. The price action remains above both the 20-day moving average (MA20) at $1,680.31 and the 50-day moving average (MA50) at $1,779.73, signaling short-term bullish momentum. However, the 200-day moving average (MA200) at $2,239.22 continues to act as a significant resistance level, reflecting the broader downtrend from earlier this year. The Bollinger Bands indicate heightened volatility, with the upper band at $1,850.41 and the lower band at $1,510.21, suggesting potential resistance near the upper band. The Relative Strength Index (RSI) at 74.01 is in overbought territory, hinting at a possible pullback or consolidation. The MACD shows a bullish crossover with the histogram at 0.099, though the signal line remains negative at -23.896, indicating mixed momentum. Key support levels are seen near the MA20 at $1,680 and the Bollinger lower band at $1,510, while resistance lies at the upper Bollinger band ($1,850) and the psychological $2,000 level. The Average True Range (ATR) of 70.06 confirms moderate volatility. Year-to-date, ETH remains well below its high of $3,397.90, with the 52-week low at $1,506.51 serving as critical support.
Technical Metrics
| Metric | Value |
|---|---|
| Current Price | $1,752.8600 |
| Daily Change | +0.58% |
| MA 20 | $1,680.3118 |
| % from MA20 | +4.32% |
| MA 50 | $1,779.7251 |
| % from MA50 | -1.51% |
| MA 200 | $2,239.2212 |
| % from MA200 | -21.72% |
| BB Upper | $1,850.4139 |
| % from BB Upper | -5.27% |
| BB Lower | $1,510.2097 |
| % from BB Lower | +16.07% |
| RSI (14) | 74.01 |
| MACD | 0.099241 |
| MACD Signal | -23.896316 |
| ATR (14) | 70.056152 |
| 3-Day High | $1,810.3298 |
| 3-Day Low | $1,711.9000 |
| 52-Week High | $3,914.8755 |
| % from 52W High | -55.23% |
| 52-Week Low | $1,506.5057 |
| % from 52W Low | +16.35% |
| YTD High | $3,397.8977 |
| % from YTD High | -48.41% |
| YTD Low | $1,506.5057 |
| % from YTD Low | +16.35% |
📊 Market Commentary
Ethereum (ETH) is trading at $1,752.86, up 0.58% today, as the market shows cautious optimism amid mixed signals. The Relative Strength Index (RSI) at 74.0 indicates ETH is approaching overbought territory, which could prompt short-term profit-taking. Despite this, bullish sentiment persists, supported by steady demand and ongoing network developments, including the continued impact of Ethereum’s transition to proof-of-stake (PoS).
ETH remains well above its 52-week low of $1,506.51 but significantly below its yearly high of $3,914.88, reflecting the broader crypto market’s volatility over the past year. Traders are closely watching the $1,800 resistance level, a psychological and technical barrier that, if broken, could signal further upside momentum. On the downside, support is seen near $1,700, followed by the $1,600 zone, which has held firm in recent weeks.
Market participants are also monitoring Ethereum’s network activity, including gas fees and decentralized application (dApp) usage, as indicators of underlying demand. Additionally, macroeconomic factors, such as Federal Reserve policy and broader risk asset trends, continue to influence ETH’s price action. While the RSI suggests caution, Ethereum’s strong fundamentals and developer activity provide a counterbalance to short-term technical pressures. Traders remain alert for any shifts in sentiment that could drive the next decisive move.
ETH remains well above its 52-week low of $1,506.51 but significantly below its yearly high of $3,914.88, reflecting the broader crypto market’s volatility over the past year. Traders are closely watching the $1,800 resistance level, a psychological and technical barrier that, if broken, could signal further upside momentum. On the downside, support is seen near $1,700, followed by the $1,600 zone, which has held firm in recent weeks.
Market participants are also monitoring Ethereum’s network activity, including gas fees and decentralized application (dApp) usage, as indicators of underlying demand. Additionally, macroeconomic factors, such as Federal Reserve policy and broader risk asset trends, continue to influence ETH’s price action. While the RSI suggests caution, Ethereum’s strong fundamentals and developer activity provide a counterbalance to short-term technical pressures. Traders remain alert for any shifts in sentiment that could drive the next decisive move.
Disclaimer
The content on MarketsFN.com is provided for educational and informational purposes only. It does not constitute financial advice or investment recommendations. All investments involve risk. Cryptocurrency markets are highly volatile. Past performance does not guarantee future results.