Ethereum Rises to $1,937 as RSI Nears Overbought Zone
· Crypto · QuoteReporter
Ethereum Rises to $1,937 as RSI Nears Overbought Zone
Ethereum (ETH/USD) | July 21, 2026 $1,936.9800 +1.75%
🔍 Technical Analysis
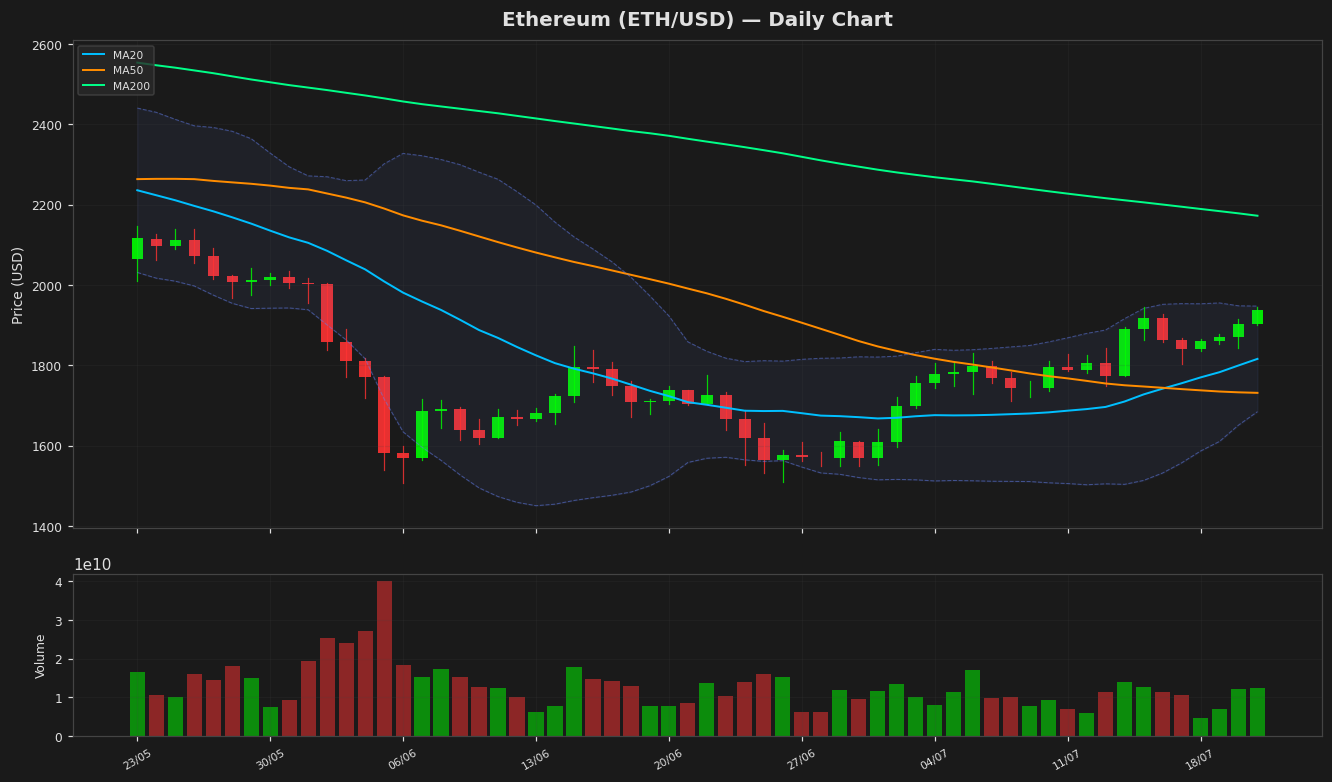
Ethereum (ETH) is currently trading at $1,936.98, up 1.75% on the day, showing bullish momentum. The price remains above both the 20-day MA ($1,815.87) and 50-day MA ($1,731.28), indicating a short-to-medium-term uptrend, though it still lags below the 200-day MA ($2,172.22), suggesting longer-term resistance remains a challenge. The Bollinger Bands show the upper band at $1,947.24 and the lower band at $1,684.49, with price hovering near the upper band, signaling potential overbought conditions or continued bullish pressure. The RSI at 68.64 is approaching overbought territory but has not yet crossed the 70 threshold, leaving room for further upside. The MACD histogram at 46.25 is above the signal line (32.12), reinforcing bullish momentum. Key support levels to watch are the 20-day MA at $1,815 and the psychological $1,800 level, while resistance lies near the upper Bollinger Band at $1,947, followed by the 200-day MA at $2,172. A break above $1,950 could target $2,000, while a drop below $1,800 may test the 50-day MA. The ATR of 62.21 suggests moderate volatility, with traders monitoring these key levels for directional cues.
Technical Metrics
| Metric | Value |
|---|---|
| Current Price | $1,936.9800 |
| Daily Change | +1.75% |
| MA 20 | $1,815.8650 |
| % from MA20 | +6.67% |
| MA 50 | $1,731.2846 |
| % from MA50 | +11.88% |
| MA 200 | $2,172.2222 |
| % from MA200 | -10.83% |
| BB Upper | $1,947.2411 |
| % from BB Upper | -0.53% |
| BB Lower | $1,684.4890 |
| % from BB Lower | +14.99% |
| RSI (14) | 68.64 |
| MACD | 46.247692 |
| MACD Signal | 32.122531 |
| ATR (14) | 62.205183 |
| 3-Day High | $1,945.1078 |
| 3-Day Low | $1,842.8157 |
| 52-Week High | $3,586.0139 |
| % from 52W High | -45.99% |
| 52-Week Low | $1,506.5057 |
| % from 52W Low | +28.57% |
| YTD High | $3,397.8977 |
| % from YTD High | -42.99% |
| YTD Low | $1,506.5057 |
| % from YTD Low | +28.57% |
📊 Market Commentary
Ethereum (ETH) is trading at $1,936.98, up 1.75% today, as bullish momentum continues to build. The Relative Strength Index (RSI) at 68.6 suggests ETH is approaching overbought territory but still has room for further upside before signaling exhaustion. The 52-week range of $1,506.51 to $3,586.01 highlights the asset's volatility, with the current price sitting closer to the lower bound, indicating potential for recovery.
Market sentiment appears cautiously optimistic, supported by steady network upgrades and growing institutional interest in Ethereum’s ecosystem. Traders are closely watching the $1,900 level, which has now turned into support after recent consolidation. A sustained hold above this zone could pave the way for a test of the next resistance near $2,000, a psychological barrier that may trigger profit-taking if reached.
On-chain metrics, including exchange outflows and staking activity, suggest accumulation among long-term holders. However, macroeconomic factors, such as Fed policy and broader crypto market trends, remain key drivers. The upcoming Ethereum network developments, including further EIP implementations, are also in focus as they could influence adoption and demand. For now, traders are monitoring RSI levels and volume trends to gauge whether the current uptrend has staying power or if a pullback toward $1,800 is likely.
Market sentiment appears cautiously optimistic, supported by steady network upgrades and growing institutional interest in Ethereum’s ecosystem. Traders are closely watching the $1,900 level, which has now turned into support after recent consolidation. A sustained hold above this zone could pave the way for a test of the next resistance near $2,000, a psychological barrier that may trigger profit-taking if reached.
On-chain metrics, including exchange outflows and staking activity, suggest accumulation among long-term holders. However, macroeconomic factors, such as Fed policy and broader crypto market trends, remain key drivers. The upcoming Ethereum network developments, including further EIP implementations, are also in focus as they could influence adoption and demand. For now, traders are monitoring RSI levels and volume trends to gauge whether the current uptrend has staying power or if a pullback toward $1,800 is likely.
Disclaimer
The content on MarketsFN.com is provided for educational and informational purposes only. It does not constitute financial advice or investment recommendations. All investments involve risk. Cryptocurrency markets are highly volatile. Past performance does not guarantee future results.