Gold Advances 0.1% near 38.2% Fibonacci resistance
· Commodities · QuoteReporter
Gold Advances 0.1% near 38.2% Fibonacci resistance
Analysis Date: May 14, 2026
📊 Current Market Data
CURRENT PRICE
$4704.00
DAILY CHANGE
+0.13%
WEEKLY CHANGE
+0.09%
52W HIGH
$5586.20
52W LOW
$3125.00
💡 Key Market Factors
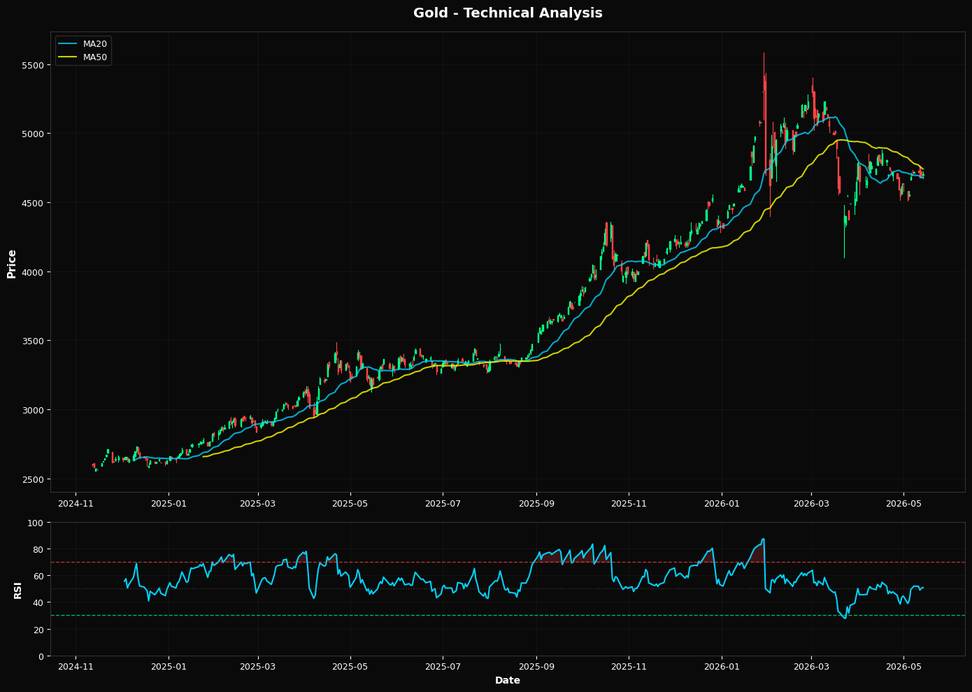
Gold's current price movement reflects a modest daily increase of 0.13% and a slight weekly gain of 0.09%, indicating a period of consolidation as it navigates around key technical levels. The Relative Strength Index (RSI) at 50.8 suggests a neutral momentum, indicating neither overbought nor oversold conditions, which aligns with the observed price stability. The proximity of the price to the 20-day moving average (MA20) at $4677.73 and the nearest Fibonacci retracement level at 38.2% ($4677.54) highlights a potential support zone, suggesting limited downside risk in the short term. From a macroeconomic perspective, inflation remains a critical factor influencing gold prices. Persistently high inflation rates could bolster gold's appeal as a hedge, especially if inflation expectations outpace real interest rates. However, recent data indicating a slowdown in inflationary pressures could temper gold's upward momentum, as it may reduce the urgency for investors to seek traditional inflation hedges. The Federal Reserve's monetary policy continues to be a pivotal determinant of gold's trajectory. With the Fed maintaining a cautious stance on interest rate adjustments, any signals of future rate hikes could exert downward pressure on gold by increasing the opportunity cost of holding non-yielding assets. Conversely, a dovish shift or prolonged pause in rate hikes could support gold prices by maintaining favorable conditions for holding the metal. Geopolitical events, while not currently at the forefront, remain a latent risk factor for gold. Any significant escalation in geopolitical tensions could rapidly enhance gold's safe-haven appeal, driving prices higher. However, absent major developments, gold's price action is likely to remain more sensitive to domestic economic indicators and central bank policies.📈 Technical Indicators Summary
RSI (14)
50.8
50-Day MA
$4741.56
200-Day MA
$4312.98
Fib Level
38.2%
📊 Technical Analysis Chart (18-Month View)
📐 Fibonacci Retracement Analysis
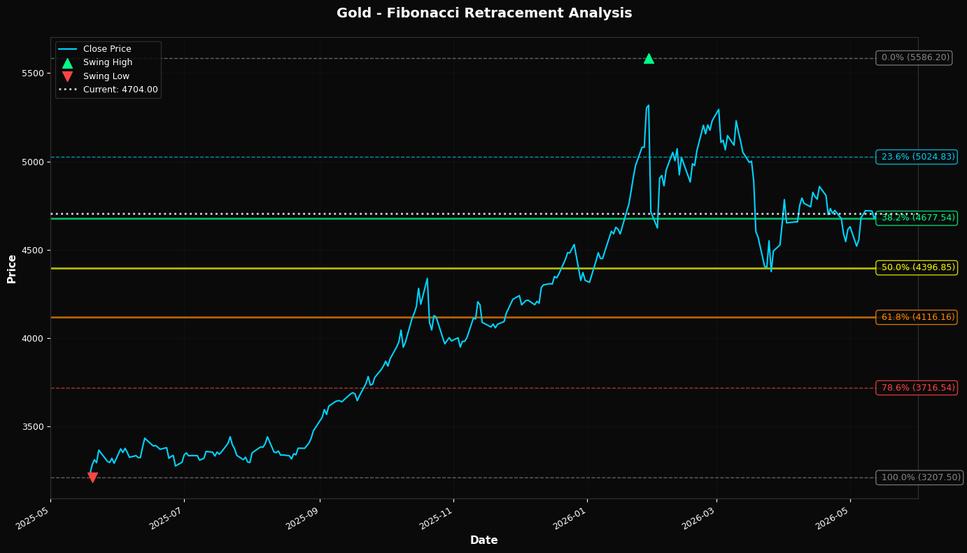
🎯 Key Trading Levels
Key Fibonacci Levels:
- 38.2%: $4677.54
- 50.0%: $4396.85
- 61.8%: $4116.16
Support: $3207.50 (Swing Low), $4741.56 (50-Day MA)
Resistance: $5586.20 (Swing High)
Disclaimer
The content on MarketsFN.com is provided for educational and informational purposes only. It does not constitute financial advice, investment recommendations, or trading guidance. All investments involve risks, and past performance does not guarantee future results. You are solely responsible for your investment decisions and should conduct independent research and consult a qualified financial advisor before acting. MarketsFN.com and its authors are not liable for any losses or damages arising from your use of this information.