Gold Advances 0.3%
· Commodities · QuoteReporter
Gold Advances 0.3%
Analysis Date: May 18, 2026
📊 Current Market Data
CURRENT PRICE
$4571.50
DAILY CHANGE
+0.34%
WEEKLY CHANGE
-3.12%
52W HIGH
$5586.20
52W LOW
$3207.50
💡 Key Market Factors
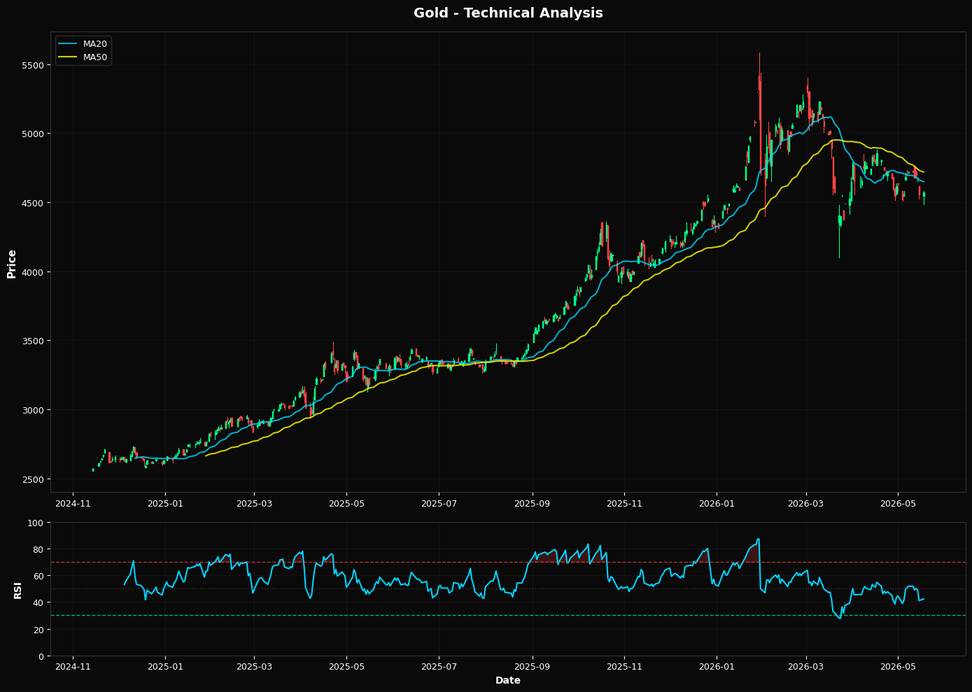
Gold prices are currently experiencing downward pressure, with a notable weekly decline of 3.12%. This movement is largely influenced by the Federal Reserve's monetary policy stance. The Fed's recent communications have indicated a commitment to maintaining higher interest rates for an extended period to combat inflation, which tends to diminish the appeal of non-yielding assets like gold. As a result, investors are recalibrating their portfolios, favoring interest-bearing securities over gold, which is contributing to the metal's recent price weakness. From a technical perspective, gold is trading below both its 20-day and 50-day moving averages, currently at $4649.59 and $4719.36, respectively. This positioning suggests a bearish trend in the short to medium term. The Relative Strength Index (RSI) is at 42.3, indicating that gold is approaching oversold territory but has not yet reached it. This could imply further downside potential unless a reversal is triggered by a significant change in market conditions. The nearest Fibonacci retracement level of 38.2% is at $4690.87, which could serve as a potential resistance point if prices attempt to recover. However, given the current macroeconomic environment, any upward momentum may face challenges unless there is a shift in the broader economic outlook or a major geopolitical event that could drive safe-haven demand. Until such catalysts emerge, gold is likely to remain under pressure, with technical indicators suggesting limited immediate upside.📈 Technical Indicators Summary
RSI (14)
42.3
50-Day MA
$4719.36
200-Day MA
$4325.54
Fib Level
38.2%
📊 Technical Analysis Chart (18-Month View)
📐 Fibonacci Retracement Analysis
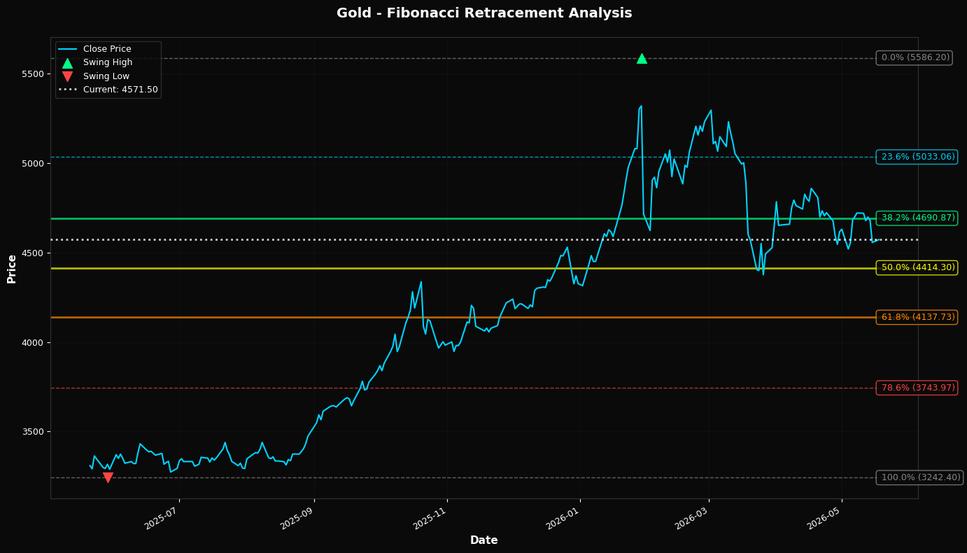
🎯 Key Trading Levels
Key Fibonacci Levels:
- 38.2%: $4690.87
- 50.0%: $4414.30
- 61.8%: $4137.73
Support: $3242.40 (Swing Low), $4719.36 (50-Day MA)
Resistance: $5586.20 (Swing High)
Disclaimer
The content on MarketsFN.com is provided for educational and informational purposes only. It does not constitute financial advice, investment recommendations, or trading guidance. All investments involve risks, and past performance does not guarantee future results. You are solely responsible for your investment decisions and should conduct independent research and consult a qualified financial advisor before acting. MarketsFN.com and its authors are not liable for any losses or damages arising from your use of this information.