Gold Advances 0.9% near 38.2% Fibonacci resistance
· Commodities · MarketsFN Team
Gold Advances 0.9% near 38.2% Fibonacci resistance
Analysis Date: May 07, 2026
📊 Current Market Data
CURRENT PRICE
$4724.90
DAILY CHANGE
+0.92%
WEEKLY CHANGE
+2.39%
52W HIGH
$5586.20
52W LOW
$3125.00
💡 Key Market Factors
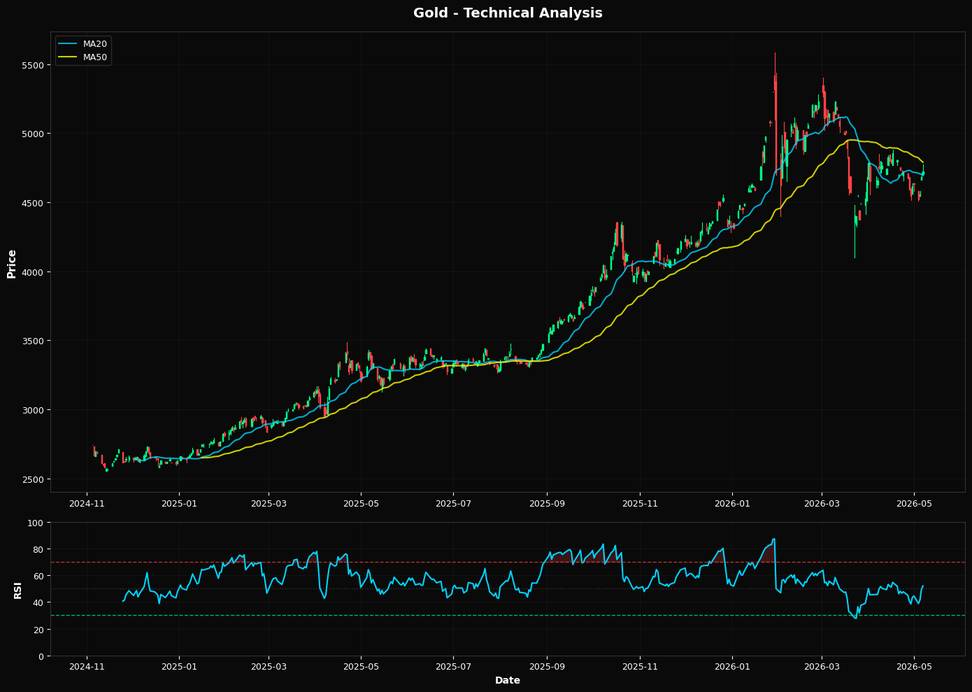
Gold is currently trading at $4724.90, reflecting a daily increase of 0.92% and a weekly gain of 2.39%. Inflation expectations remain a critical factor, as persistent inflationary pressures continue to bolster gold's appeal as a hedge. Recent data indicating stubbornly high inflation has reinforced the metal's attractiveness, driving demand among investors seeking to preserve purchasing power. Interest rate dynamics are also pivotal, with the Federal Reserve's recent comments suggesting a potential pause in rate hikes. This dovish stance has eased upward pressure on real yields, providing support to gold prices. As the market anticipates future monetary policy adjustments, any signals of prolonged rate stability could further underpin gold's strength. From a technical perspective, gold is navigating a critical zone, with the price slightly above the 20-day moving average of $4698.80 but below the 50-day moving average at $4790.28. The RSI at 52.0 indicates a neutral momentum, suggesting a balanced market without overbought or oversold conditions. Key support is identified at the Fibonacci level of 38.2% at $4646.02, while resistance remains at the 50-day moving average, which could act as a barrier to further gains.📈 Technical Indicators Summary
RSI (14)
52.0
50-Day MA
$4790.28
200-Day MA
$4279.17
Fib Level
38.2%
📊 Technical Analysis Chart (18-Month View)
📐 Fibonacci Retracement Analysis
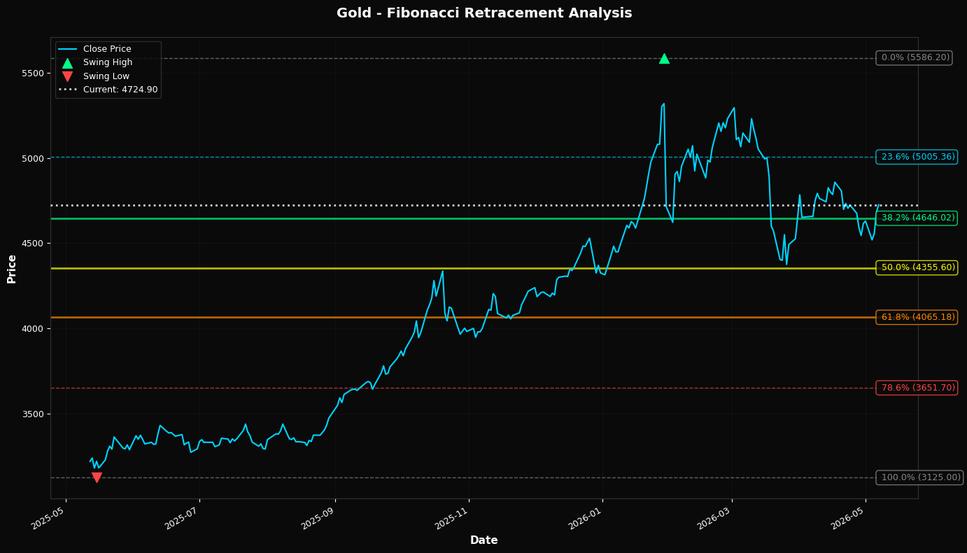
🎯 Key Trading Levels
Key Fibonacci Levels:
- 38.2% Level: $4646.02
- 50.0% Level: $4355.60
- 61.8% Level: $4065.18
Support: $3125.00 (Swing Low), $4790.28 (50-day MA)
Resistance: $5586.20 (Swing High)
Disclaimer
The content on MarketsFN.com is provided for educational and informational purposes only. It does not constitute financial advice, investment recommendations, or trading guidance. All investments involve risks, and past performance does not guarantee future results. You are solely responsible for your investment decisions and should conduct independent research and consult a qualified financial advisor before acting. MarketsFN.com and its authors are not liable for any losses or damages arising from your use of this information.