Gold Declines 0.2% near 50.0% Fibonacci resistance
· Commodities · QuoteReporter
Gold Declines 0.2% near 50.0% Fibonacci resistance
Analysis Date: May 20, 2026
📊 Current Market Data
CURRENT PRICE
$4499.50
DAILY CHANGE
-0.15%
WEEKLY CHANGE
-4.22%
52W HIGH
$5586.20
52W LOW
$3242.40
💡 Key Market Factors
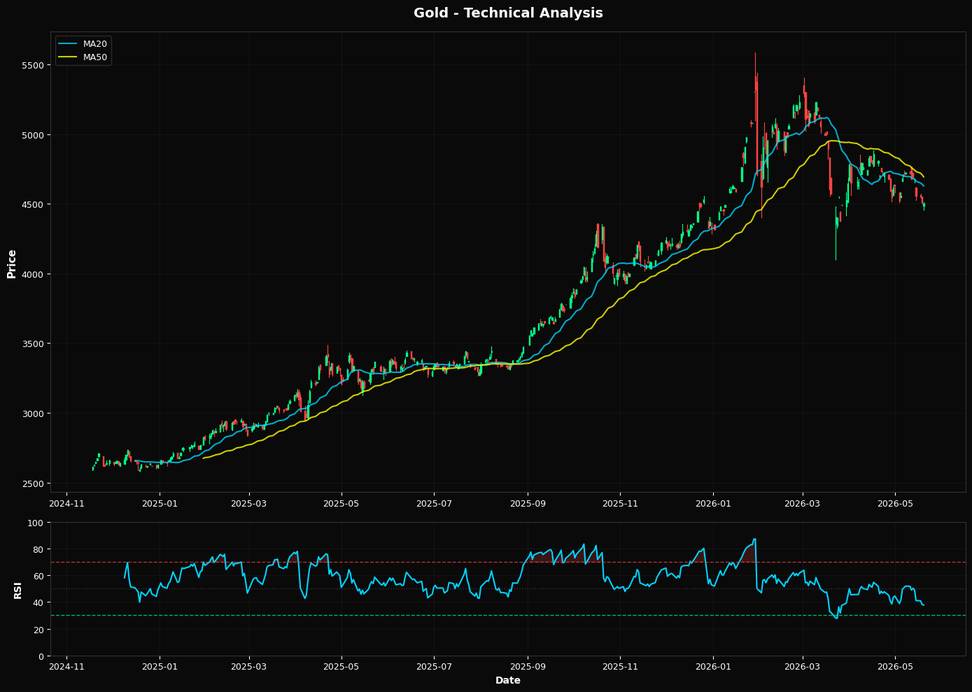
Gold prices have seen a notable decline, with a weekly drop of 4.22%, positioning the current price at $4499.50. This movement comes amid a broader market reaction to the Federal Reserve's recent signaling of a potential continuation of higher interest rates for an extended period. The Fed's stance is primarily driven by persistent inflationary pressures, which have not yet subsided to the target levels, thus dampening gold's appeal as a non-yielding asset. From a technical perspective, gold's Relative Strength Index (RSI) is currently at 37.8, indicating that the metal is approaching oversold territory, which could potentially trigger a technical rebound. However, the price remains below both the 20-day and 50-day moving averages, at $4627.38 and $4692.68, respectively, suggesting a bearish trend in the short to medium term. The nearest Fibonacci retracement level at 50.0% is at $4414.30, which could act as a support level if the downward momentum continues. Geopolitical factors have not significantly impacted gold prices recently, with no major events altering the current market dynamics. However, any sudden escalation in geopolitical tensions could provide a catalyst for a reversal in gold's fortunes, as investors typically flock to safe-haven assets during periods of uncertainty. For now, the primary focus remains on U.S. monetary policy and its implications for global financial markets.📈 Technical Indicators Summary
RSI (14)
37.8
50-Day MA
$4692.68
200-Day MA
$4336.87
Fib Level
50.0%
📊 Technical Analysis Chart (18-Month View)
📐 Fibonacci Retracement Analysis
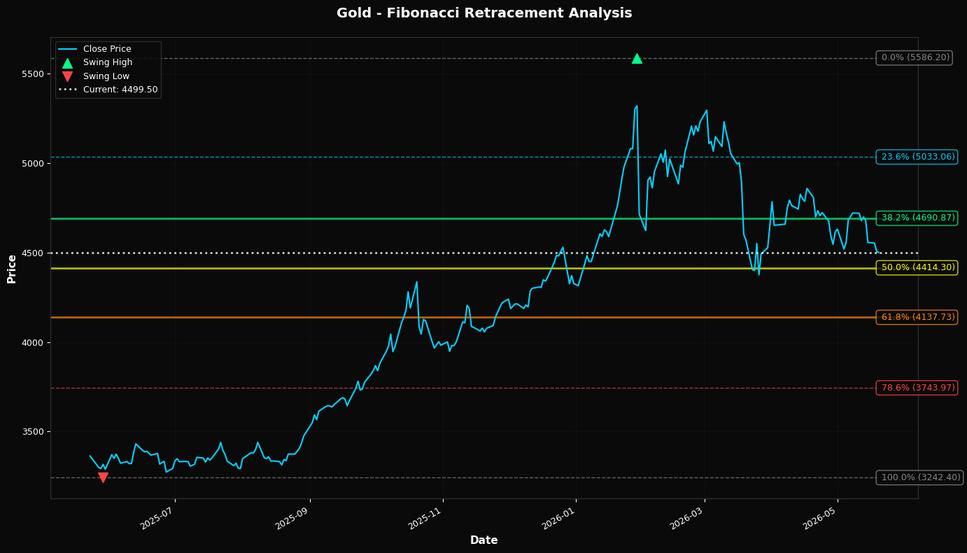
🎯 Key Trading Levels
Key Fibonacci Levels:
- 38.2%: $4690.87
- 50.0%: $4414.30
- 61.8%: $4137.73
Support: $3242.40 (Swing Low), $4692.68 (50-Day MA)
Resistance: $5586.20 (Swing High)
Disclaimer
The content on MarketsFN.com is provided for educational and informational purposes only. It does not constitute financial advice, investment recommendations, or trading guidance. All investments involve risks, and past performance does not guarantee future results. You are solely responsible for your investment decisions and should conduct independent research and consult a qualified financial advisor before acting. MarketsFN.com and its authors are not liable for any losses or damages arising from your use of this information.