Gold Declines 0.3% near 38.2% Fibonacci resistance
· Commodities · MarketsFN Team
Gold Declines 0.3% near 38.2% Fibonacci resistance
Analysis Date: May 12, 2026
📊 Current Market Data
CURRENT PRICE
$4703.50
DAILY CHANGE
-0.32%
WEEKLY CHANGE
+3.24%
52W HIGH
$5586.20
52W LOW
$3125.00
💡 Key Market Factors
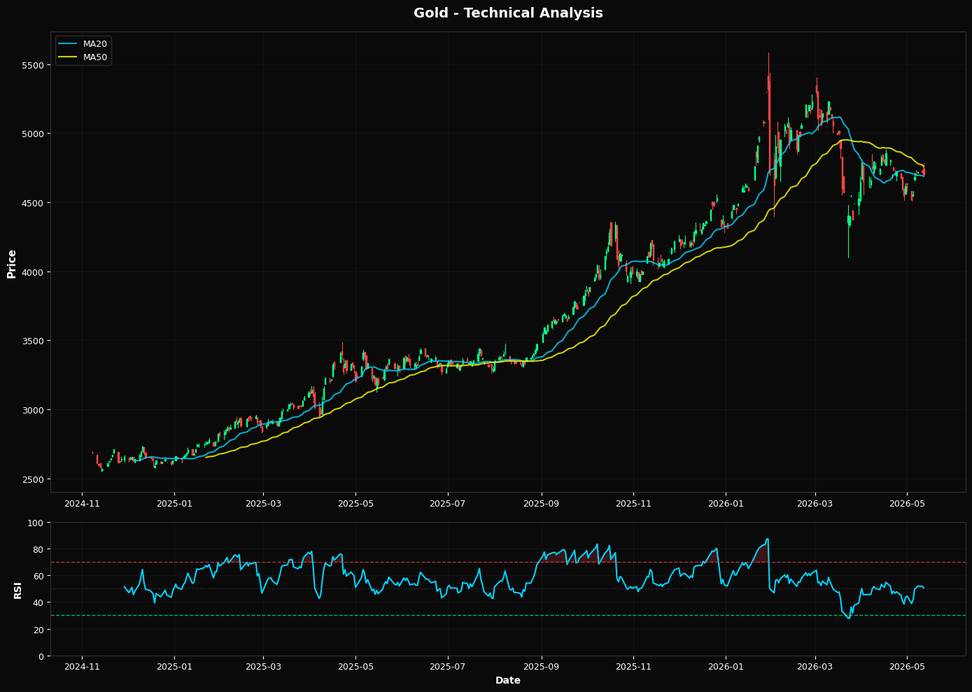
Gold's recent price action shows a modest decline of 0.32% on the day, but it remains up by 3.24% over the week, reflecting a positive trend amid fluctuating inflation expectations. With inflationary pressures still a concern, gold's appeal as a hedge remains intact, although recent data suggests a stabilizing inflation outlook, which could temper further gains. Interest rate dynamics continue to play a crucial role in gold's valuation. The Federal Reserve's recent indications of a potential pause in rate hikes have provided some support to gold prices, as lower interest rates reduce the opportunity cost of holding non-yielding assets like gold. However, any hawkish surprises from upcoming Fed meetings could pressure prices downward. From a technical perspective, gold is trading near its 20-day moving average of $4688.21, suggesting a neutral to slightly bullish short-term outlook. The Relative Strength Index (RSI) at 50.7 indicates a balanced momentum, neither overbought nor oversold. Key support is seen at the Fibonacci 38.2% retracement level of $4646.02, while resistance remains around the 50-day moving average of $4758.60, which could pose a challenge for further upward movement.📈 Technical Indicators Summary
RSI (14)
50.7
50-Day MA
$4758.60
200-Day MA
$4299.26
Fib Level
38.2%
📊 Technical Analysis Chart (18-Month View)
📐 Fibonacci Retracement Analysis
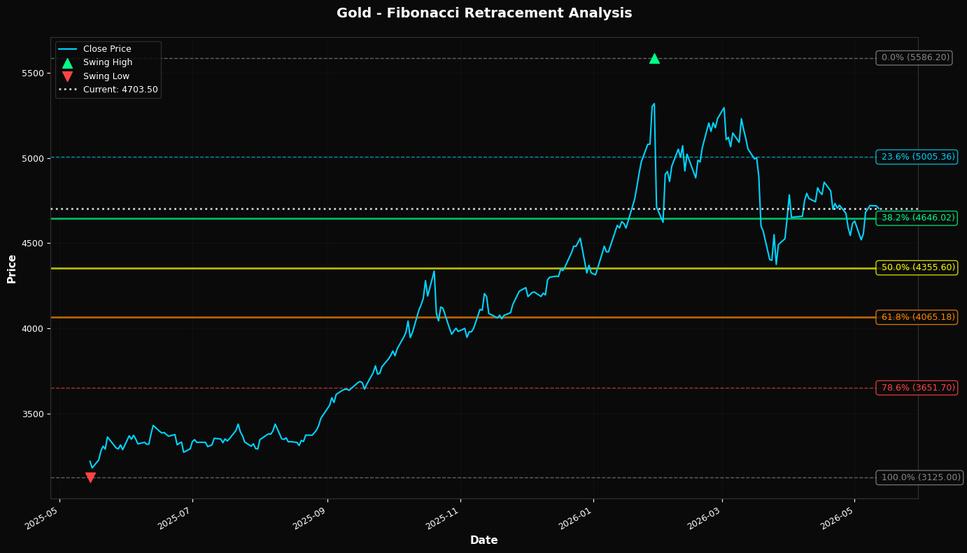
🎯 Key Trading Levels
Key Fibonacci Levels:
- 38.2% Level: $4646.02
- 50.0% Level: $4355.60
- 61.8% Level: $4065.18
Support: $3125.00 (Swing Low), $4758.60 (50-day MA)
Resistance: $5586.20 (Swing High)
Disclaimer
The content on MarketsFN.com is provided for educational and informational purposes only. It does not constitute financial advice, investment recommendations, or trading guidance. All investments involve risks, and past performance does not guarantee future results. You are solely responsible for your investment decisions and should conduct independent research and consult a qualified financial advisor before acting. MarketsFN.com and its authors are not liable for any losses or damages arising from your use of this information.