Gold Declines 0.4% near 38.2% Fibonacci resistance
· Commodities · MarketsFN Team
Gold Declines 0.4% near 38.2% Fibonacci resistance
Analysis Date: April 24, 2026
📊 Current Market Data
CURRENT PRICE
$4688.30
DAILY CHANGE
-0.36%
WEEKLY CHANGE
-3.49%
52W HIGH
$5586.20
52W LOW
$3125.00
💡 Key Market Factors
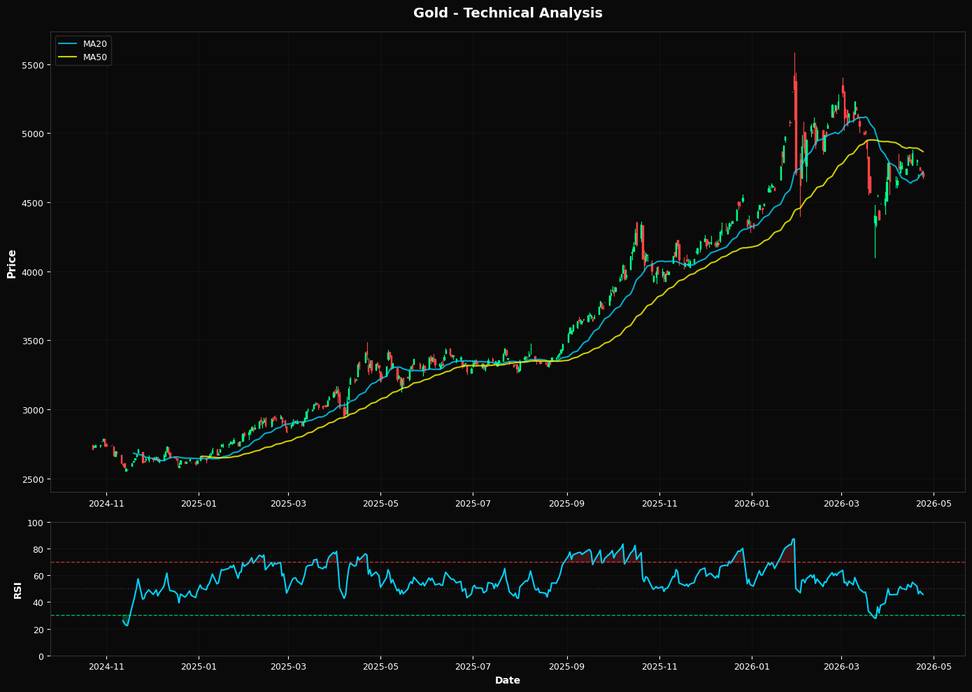
Gold is currently experiencing downward pressure, with a price decrease of 0.36% daily and 3.49% weekly, reflecting a bearish sentiment. The Relative Strength Index (RSI) at 45.7 suggests that gold is neither overbought nor oversold, indicating a neutral momentum in the short term. The price is below both the 20-day and 50-day moving averages, reinforcing the bearish trend and suggesting potential further downside. Inflation expectations remain a key driver for gold prices, but recent data suggest a moderation in inflationary pressures, reducing gold's appeal as an inflation hedge. This has contributed to the recent price decline, as investors shift focus to other assets amid changing inflation dynamics. Interest rate policies continue to weigh heavily on gold, with the Federal Reserve maintaining a hawkish stance. The potential for further rate hikes increases the opportunity cost of holding non-yielding assets like gold, contributing to its recent price weakness. Technically, gold is approaching a key Fibonacci support level at $4646.02, which could provide some buying interest. However, sustained trading below this level might lead to further declines. Resistance is noted at the 20-day moving average of $4717.96, which needs to be breached for any bullish reversal to gain traction.📈 Technical Indicators Summary
RSI (14)
45.7
50-Day MA
$4867.17
200-Day MA
$4222.51
Fib Level
38.2%
📊 Technical Analysis Chart (18-Month View)
📐 Fibonacci Retracement Analysis
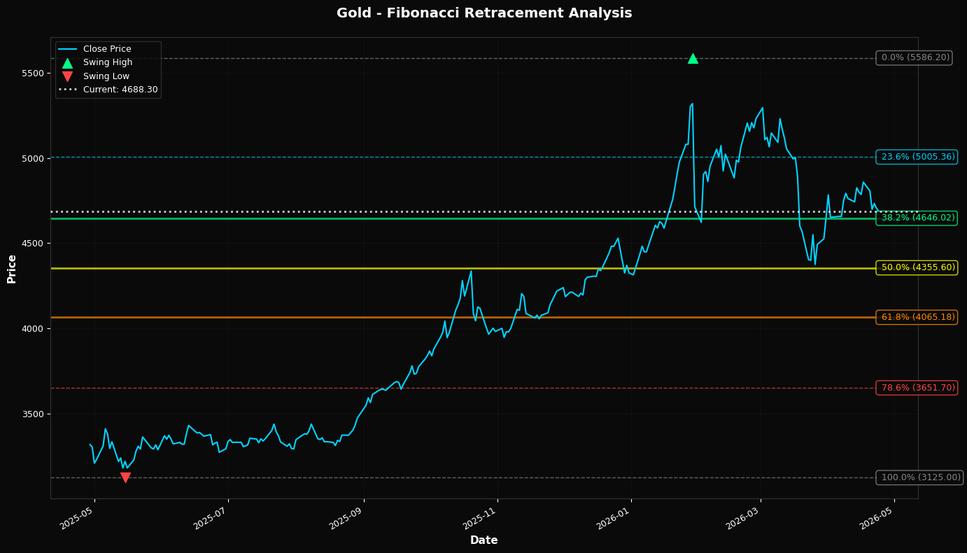
🎯 Key Trading Levels
Key Fibonacci Levels:
- 38.2% Level: $4646.02
- 50.0% Level: $4355.60
- 61.8% Level: $4065.18
Support: $3125.00 (Swing Low), $4867.17 (50-day MA)
Resistance: $5586.20 (Swing High)
Disclaimer
The content on MarketsFN.com is provided for educational and informational purposes only. It does not constitute financial advice, investment recommendations, or trading guidance. All investments involve risks, and past performance does not guarantee future results. You are solely responsible for your investment decisions and should conduct independent research and consult a qualified financial advisor before acting. MarketsFN.com and its authors are not liable for any losses or damages arising from your use of this information.