Gold Declines 0.6% near 38.2% Fibonacci resistance
· Commodities · MarketsFN Team
Gold Declines 0.6% near 38.2% Fibonacci resistance
Analysis Date: May 04, 2026
📊 Current Market Data
CURRENT PRICE
$4601.90
DAILY CHANGE
-0.60%
WEEKLY CHANGE
-1.57%
52W HIGH
$5586.20
52W LOW
$3125.00
💡 Key Market Factors
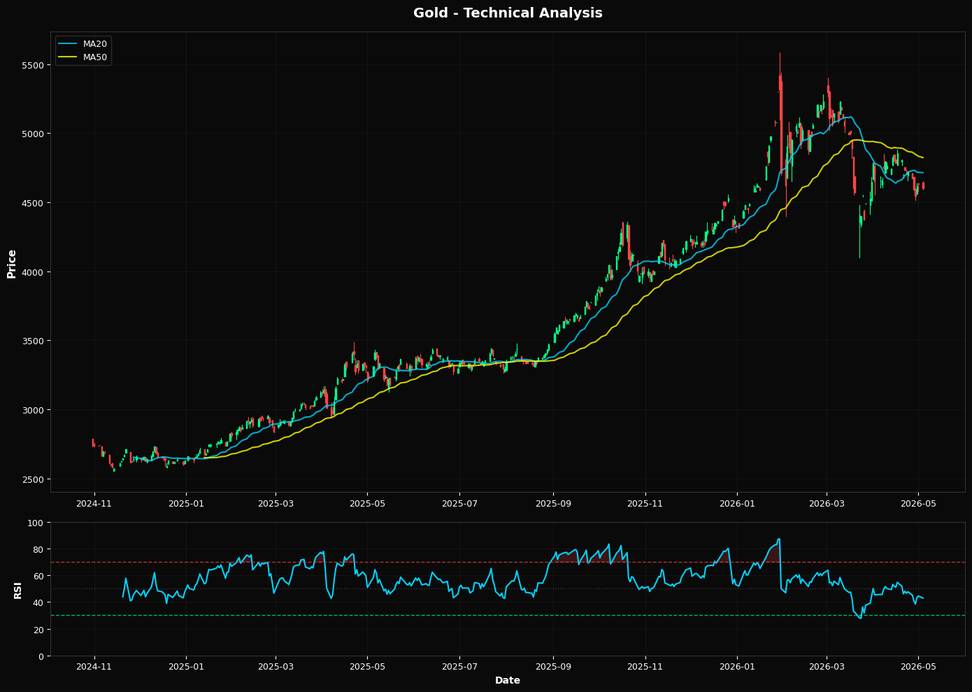
Gold prices are currently under pressure, with a daily decline of 0.60% and a weekly drop of 1.57%, reflecting ongoing market concerns. The Relative Strength Index (RSI) at 42.9 suggests that gold is nearing oversold conditions, indicating potential for a reversal, but not yet confirming it. The price is trading below both the 20-day and 50-day moving averages, which are at $4714.73 and $4824.01 respectively, signaling a bearish trend. From a macroeconomic perspective, the Federal Reserve's recent stance on maintaining higher interest rates for longer is weighing on gold prices. Higher interest rates increase the opportunity cost of holding non-yielding assets like gold, thereby reducing its attractiveness. This policy direction is likely to continue exerting downward pressure unless inflation expectations shift significantly. On the technical front, gold is approaching a critical Fibonacci support level at $4646.02. A breach below this level could accelerate the downside momentum, while a bounce could provide a short-term reprieve. Traders should watch this level closely, as it could determine the near-term direction of gold prices.📈 Technical Indicators Summary
RSI (14)
42.9
50-Day MA
$4824.01
200-Day MA
$4260.74
Fib Level
38.2%
📊 Technical Analysis Chart (18-Month View)
📐 Fibonacci Retracement Analysis
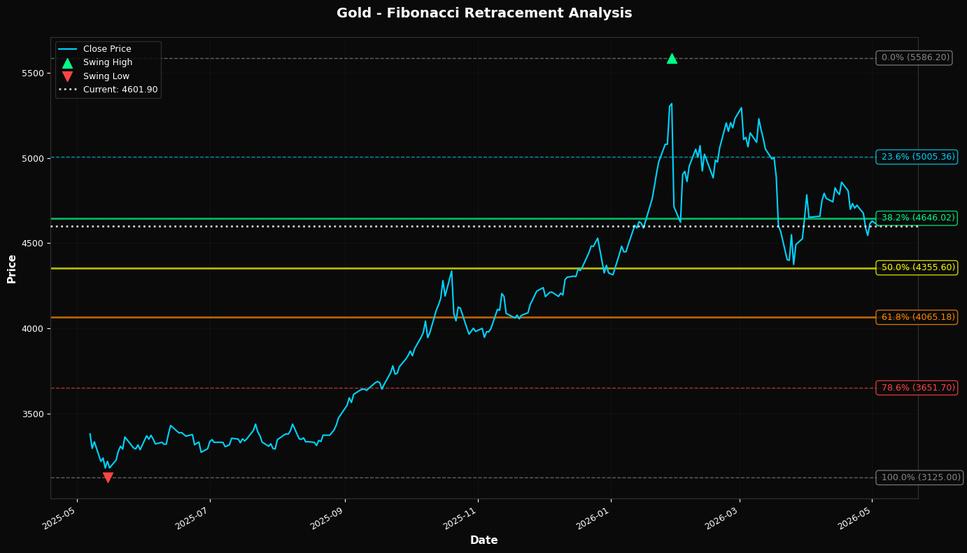
🎯 Key Trading Levels
Key Fibonacci Levels:
- 38.2% Level: $4646.02
- 50.0% Level: $4355.60
- 61.8% Level: $4065.18
Support: $3125.00 (Swing Low), $4824.01 (50-day MA)
Resistance: $5586.20 (Swing High)
Disclaimer
The content on MarketsFN.com is provided for educational and informational purposes only. It does not constitute financial advice, investment recommendations, or trading guidance. All investments involve risks, and past performance does not guarantee future results. You are solely responsible for your investment decisions and should conduct independent research and consult a qualified financial advisor before acting. MarketsFN.com and its authors are not liable for any losses or damages arising from your use of this information.