Gold: Down 0.1% to $4471.70 — Testing 50.0% Fibonacci Support
· Commodities · QuoteReporter
Gold: Down 0.1% to $4471.70 — Testing 50.0% Fibonacci Support
Analysis Date: June 05, 2026
📊 Current Market Data
CURRENT PRICE
$4471.70
DAILY CHANGE
-0.09%
WEEKLY CHANGE
-1.95%
52W HIGH
$5586.20
52W LOW
$3253.80
💡 Key Market Factors
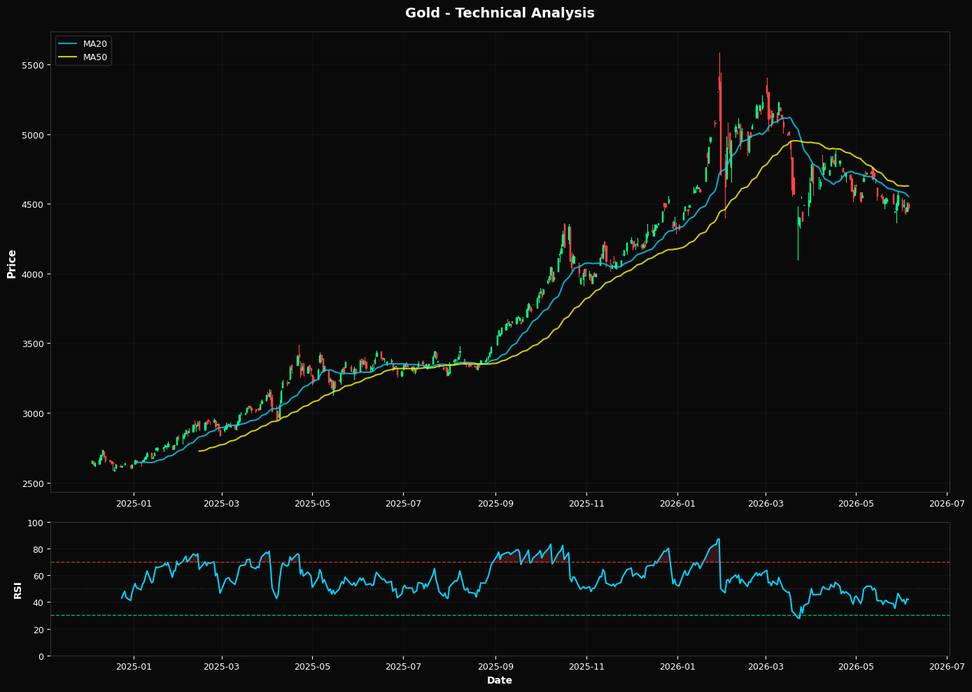
Gold is currently navigating a precarious position, with its price at $4471.70, just above a critical Fibonacci support level at $4420.00. The most pressing macro driver impacting gold today is the Federal Reserve's interest rate policy. With inflationary pressures still a concern, the Fed's stance on interest rates remains hawkish. This environment typically strengthens the U.S. dollar, which inversely affects gold prices. As the Fed signals potential rate hikes, gold's appeal as a non-yielding asset diminishes, contributing to its recent decline of -1.95% over the past week. From a technical perspective, gold's Relative Strength Index (RSI) at 41.9 suggests it is approaching oversold territory, but not quite there yet. The current price is below both the 20-day moving average ($4552.77) and the 50-day moving average ($4626.75), indicating a bearish trend. However, it remains above the 200-day moving average ($4399.22), which could provide some long-term support. The proximity to the 50.0% Fibonacci retracement level at $4420.00 is crucial; a breach below this could accelerate selling pressure. Given these technical indicators, the directional bias for gold is bearish in the short term, unless it can hold above the Fibonacci support. A key risk that could alter this bearish outlook is a significant shift in U.S. economic data, particularly employment figures. A weaker-than-expected jobs report could prompt the Fed to reconsider its aggressive rate hike trajectory, potentially weakening the dollar and providing a boost to gold prices. Conversely, stronger employment data would likely reinforce the Fed's current policy path, further pressuring gold. The upcoming U.S. employment report will be a pivotal catalyst. Should the data reveal a slowdown in job growth, it could validate a bullish reversal for gold, as it might signal a pause or slowdown in rate hikes. Conversely, robust employment figures would likely confirm the bearish trend, reinforcing the Fed's hawkish stance and keeping downward pressure on gold. This report will be crucial in determining whether gold can maintain its footing above the critical $4420.00 support level or if it will succumb to further declines.📈 Technical Indicators Summary
RSI (14)
41.9
50-Day MA
$4626.75
200-Day MA
$4399.22
Fib Level
50.0%
📊 Technical Analysis Chart (18-Month View)
📐 Fibonacci Retracement Analysis
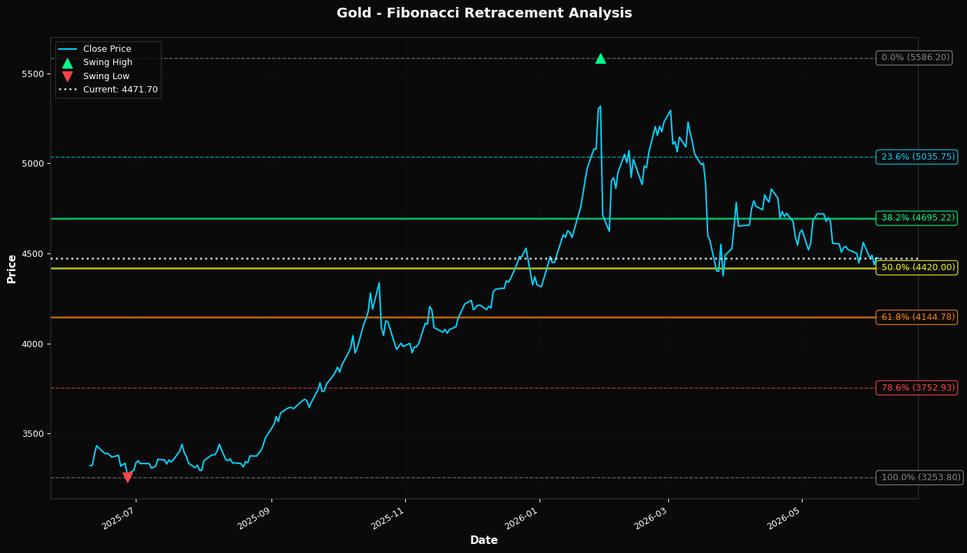
🎯 Key Trading Levels
Key Fibonacci Levels:
- 38.2%: $4695.22
- 50.0%: $4420.00
- 61.8%: $4144.78
Support: $3253.80 (Swing Low), $4626.75 (50-Day MA)
Resistance: $5586.20 (Swing High)
Disclaimer
The content on MarketsFN.com is provided for educational and informational purposes only. It does not constitute financial advice, investment recommendations, or trading guidance. All investments involve risks, and past performance does not guarantee future results. You are solely responsible for your investment decisions and should conduct independent research and consult a qualified financial advisor before acting. MarketsFN.com and its authors are not liable for any losses or damages arising from your use of this information.