Gold: Down 0.2% to $4216.30 — Testing 61.8% Fibonacci Support
· Commodities · QuoteReporter
Gold: Down 0.2% to $4216.30 — Testing 61.8% Fibonacci Support
Analysis Date: June 22, 2026
📊 Current Market Data
CURRENT PRICE
$4216.30
DAILY CHANGE
-0.18%
WEEKLY CHANGE
+0.03%
52W HIGH
$5586.20
52W LOW
$3253.80
💡 Key Market Factors
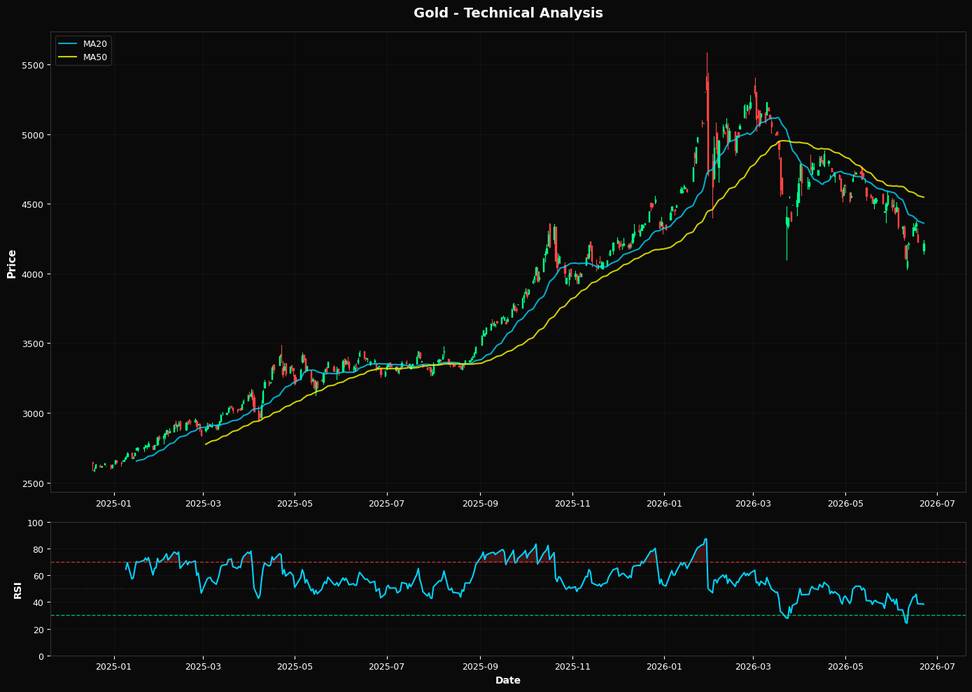
Gold's current price action suggests a bearish outlook, driven by technical weakness and macroeconomic pressures. The most pressing macro driver for gold today is the Federal Reserve's monetary policy, particularly its interest rate stance. With gold priced at $4216.30, a daily decline of 0.18%, the market is reacting to the Fed's hawkish tone. Higher interest rates increase the opportunity cost of holding non-yielding assets like gold, making it less attractive. As the Fed continues to prioritize inflation control, the potential for further rate hikes looms, exerting downward pressure on gold prices. The market may be underestimating the Fed's resolve to maintain higher rates for longer, which could further weigh on gold. From a technical perspective, gold is struggling to find support. The Relative Strength Index (RSI) at 38.4 indicates that gold is approaching oversold territory, yet it hasn't reached a level that typically signals a reversal. The price is significantly below its 20-day moving average of $4360.51, the 50-day moving average of $4546.79, and the 200-day moving average of $4439.53, underscoring a bearish trend. The nearest Fibonacci support level at 61.8% is $4144.78, suggesting that if gold breaches this level, further declines could be imminent. The alignment of these technical indicators points to continued downside risk unless a strong catalyst emerges. A key risk that could alter this bearish outlook is a significant shift in U.S. economic data, particularly inflation figures. If upcoming inflation data shows a marked decrease, it could prompt the Fed to reconsider its aggressive rate hike trajectory, providing relief to gold prices. Conversely, stronger-than-expected inflation data would likely reinforce the Fed's current policy stance, exacerbating gold's decline. The market may not fully appreciate the potential for a rapid change in inflation dynamics, which could catch investors off guard. Looking ahead, the next major catalyst will be the release of the U.S. Consumer Price Index (CPI) data. A lower-than-expected CPI reading could validate a bullish reversal in gold, as it might signal a shift in Fed policy expectations. On the other hand, a higher-than-expected CPI would likely confirm the current bearish trend, reinforcing the Fed's commitment to rate hikes and further pressuring gold prices. Investors should closely monitor this data point, as it will be pivotal in shaping gold's near-term trajectory.📈 Technical Indicators Summary
RSI (14)
38.4
50-Day MA
$4546.79
200-Day MA
$4439.53
Fib Level
61.8%
📊 Technical Analysis Chart (18-Month View)
📐 Fibonacci Retracement Analysis
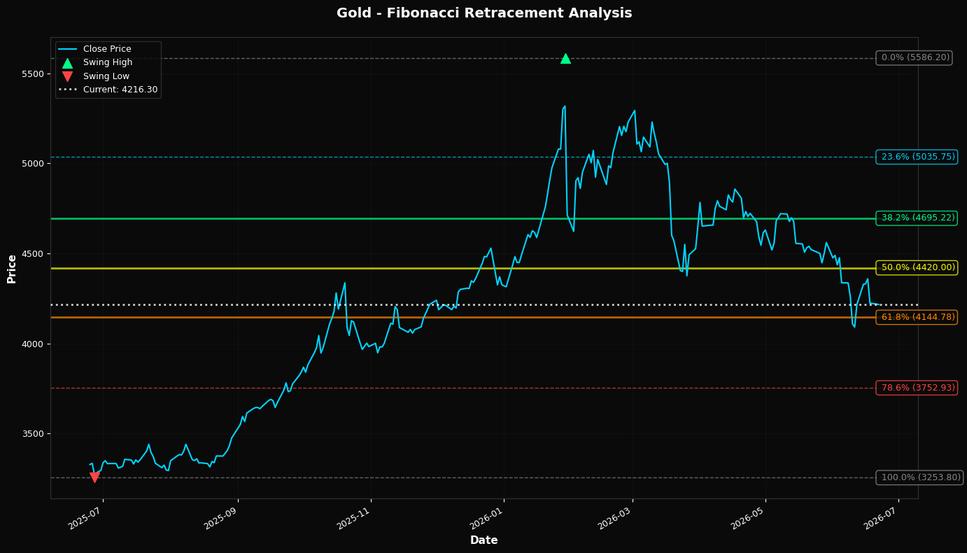
🎯 Key Trading Levels
Key Fibonacci Levels:
- 38.2%: $4695.22
- 50.0%: $4420.00
- 61.8%: $4144.78
Support: $3253.80 (Swing Low), $4546.79 (50-Day MA)
Resistance: $5586.20 (Swing High)
Disclaimer
The content on MarketsFN.com is provided for educational and informational purposes only. It does not constitute financial advice, investment recommendations, or trading guidance. All investments involve risks, and past performance does not guarantee future results. You are solely responsible for your investment decisions and should conduct independent research and consult a qualified financial advisor before acting. MarketsFN.com and its authors are not liable for any losses or damages arising from your use of this information.