Gold: Down 1.1% to $4178.80 — Testing 61.8% Fibonacci Support
· Commodities · QuoteReporter
Gold: Down 1.1% to $4178.80 — Testing 61.8% Fibonacci Support
Analysis Date: June 19, 2026
📊 Current Market Data
CURRENT PRICE
$4178.80
DAILY CHANGE
-1.07%
WEEKLY CHANGE
-0.86%
52W HIGH
$5586.20
52W LOW
$3253.80
💡 Key Market Factors
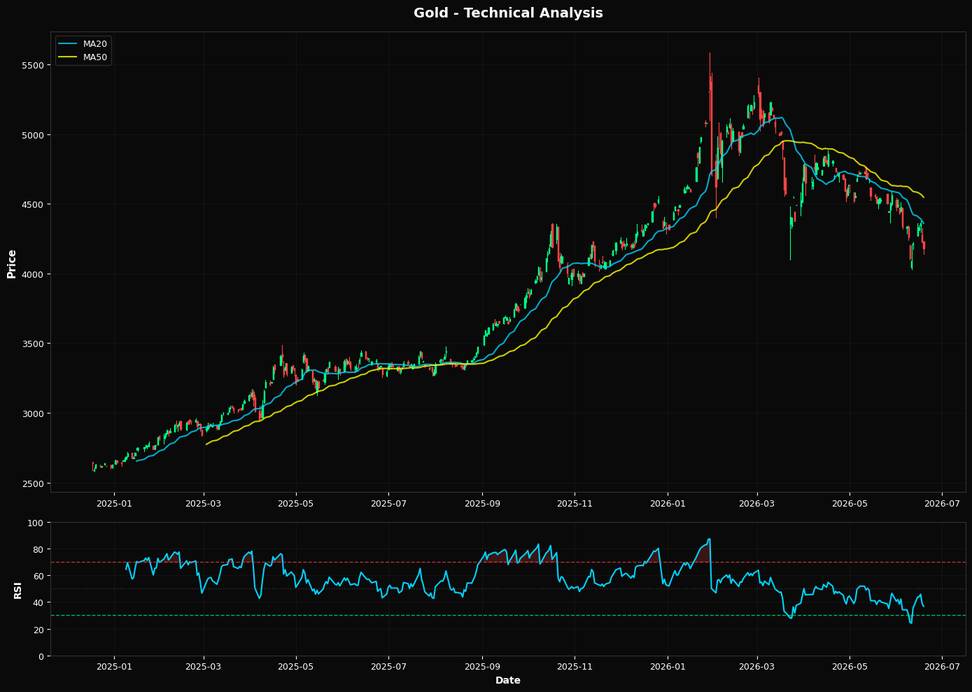
**Headline Insight: Gold's current price action suggests a bearish outlook, driven by technical weakness and macroeconomic pressures from a strong U.S. dollar.** The most pressing macro driver for gold today is the strength of the U.S. dollar. As gold is priced in dollars, a stronger dollar makes gold more expensive for foreign buyers, reducing demand. Currently, the dollar's strength is largely influenced by the Federal Reserve's hawkish stance on interest rates. With inflation still a concern, the Fed is likely to maintain or even increase rates, which supports the dollar. This dynamic is putting downward pressure on gold prices, as evidenced by the current price of $4178.80, which is down 1.07% daily and 0.86% weekly. The market may be underpricing the potential for further dollar appreciation, which could exacerbate gold's decline. From a technical perspective, gold is showing signs of weakness. The Relative Strength Index (RSI) at 36.7 indicates that gold is approaching oversold territory, yet it hasn't reached the critical level of 30, suggesting there might still be room for further downside. The price is significantly below its 20-day, 50-day, and 200-day moving averages ($4358.63, $4546.04, and $4439.35, respectively), reinforcing a bearish trend. The nearest Fibonacci support level at 61.8% is $4144.78, which is close to the current price, suggesting that a breach of this level could lead to further declines. The market may be underestimating the potential for a sharp drop if this support fails. A key risk that could alter this bearish outlook is a significant shift in Federal Reserve policy. If upcoming economic data, such as the next inflation report, shows a substantial decrease in inflationary pressures, the Fed might pivot to a more dovish stance. This could weaken the dollar and provide support for gold prices. Conversely, if inflation remains stubbornly high, reinforcing the Fed's current policy path, gold could continue its downward trajectory. The next inflation report will be crucial in confirming or invalidating this view, as it will directly influence the Fed's policy decisions and, consequently, the dollar's strength.📈 Technical Indicators Summary
RSI (14)
36.7
50-Day MA
$4546.04
200-Day MA
$4439.35
Fib Level
61.8%
📊 Technical Analysis Chart (18-Month View)
📐 Fibonacci Retracement Analysis
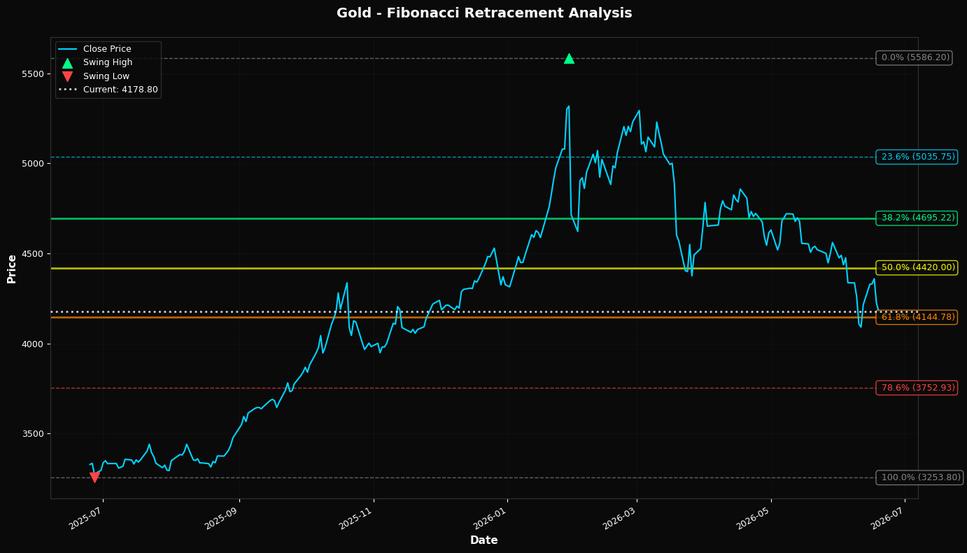
🎯 Key Trading Levels
Key Fibonacci Levels:
- 38.2%: $4695.22
- 50.0%: $4420.00
- 61.8%: $4144.78
Support: $3253.80 (Swing Low), $4546.04 (50-Day MA)
Resistance: $5586.20 (Swing High)
Disclaimer
The content on MarketsFN.com is provided for educational and informational purposes only. It does not constitute financial advice, investment recommendations, or trading guidance. All investments involve risks, and past performance does not guarantee future results. You are solely responsible for your investment decisions and should conduct independent research and consult a qualified financial advisor before acting. MarketsFN.com and its authors are not liable for any losses or damages arising from your use of this information.