Gold: Down 2.0% to $4272.20 — Below MA50 ($4559.27) — Caution
· Commodities · QuoteReporter
Gold: Down 2.0% to $4272.20 — Below MA50 ($4559.27) — Caution
Analysis Date: June 18, 2026
📊 Current Market Data
CURRENT PRICE
$4272.20
DAILY CHANGE
-1.99%
WEEKLY CHANGE
+4.45%
52W HIGH
$5586.20
52W LOW
$3253.80
💡 Key Market Factors
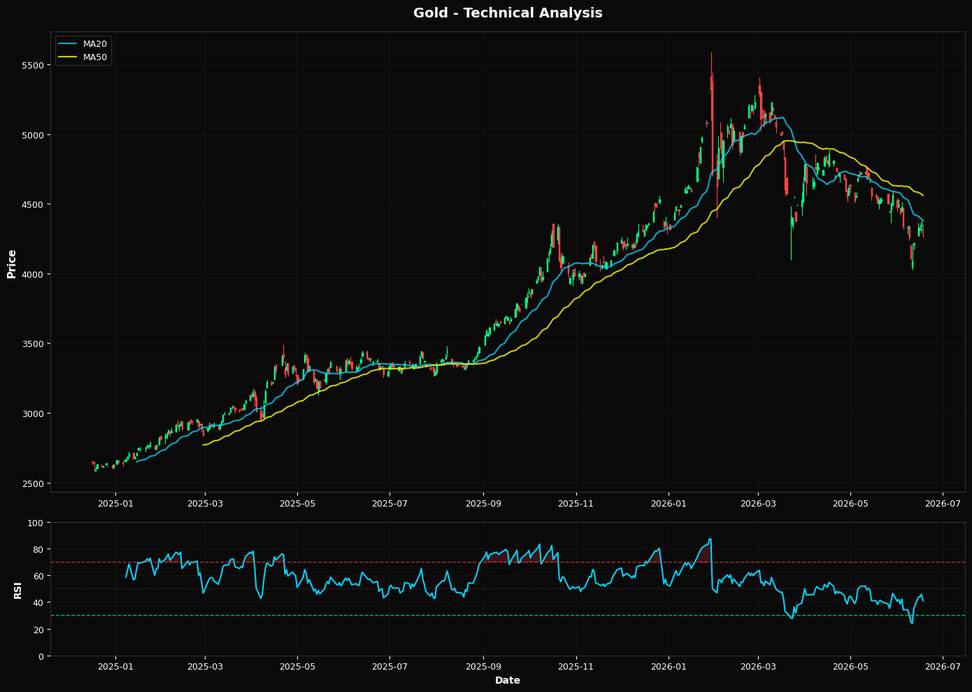
Gold's recent price action suggests a potential pullback, with the commodity trading at $4272.20, down 1.99% daily but still up 4.45% weekly. The most pressing macro driver for gold right now is the U.S. dollar's strength, which has been bolstered by the Federal Reserve's hawkish stance on interest rates. As the Fed continues to signal higher rates for longer, the dollar remains strong, exerting downward pressure on gold prices. This dynamic is crucial because gold, priced in dollars, becomes more expensive for foreign buyers when the dollar appreciates, dampening demand. From a technical perspective, gold's Relative Strength Index (RSI) at 41.0 indicates that it is approaching oversold territory, suggesting potential for a rebound. However, the current price is below both the 20-day moving average ($4379.09) and the 200-day moving average ($4436.66), signaling a bearish trend. The 50-day moving average at $4559.27 further reinforces this bearish outlook. The nearest Fibonacci support level at 61.8% is $4144.78, which could serve as a critical support point if the price continues to decline. Given these technical indicators, the directional bias for gold is bearish in the short term, with potential support at the Fibonacci level. A key risk that could alter this bearish outlook is a significant shift in U.S. economic data, particularly inflation figures. If upcoming inflation data shows a marked decrease, it could prompt the Fed to reconsider its aggressive rate hike trajectory, potentially weakening the dollar and providing a boost to gold prices. Conversely, stronger-than-expected inflation data would likely reinforce the Fed's current policy, maintaining pressure on gold. The market may be underpricing the potential impact of geopolitical tensions, which could act as a catalyst for gold. Historically, gold has been a safe haven during periods of geopolitical instability. If tensions escalate, demand for gold could surge, counteracting the bearish technical setup. The upcoming release of U.S. inflation data will be pivotal in confirming or invalidating the current bearish view. A softer inflation print could signal a shift in Fed policy expectations, providing a much-needed tailwind for gold.📈 Technical Indicators Summary
RSI (14)
41.0
50-Day MA
$4559.27
200-Day MA
$4436.66
Fib Level
61.8%
📊 Technical Analysis Chart (18-Month View)
📐 Fibonacci Retracement Analysis
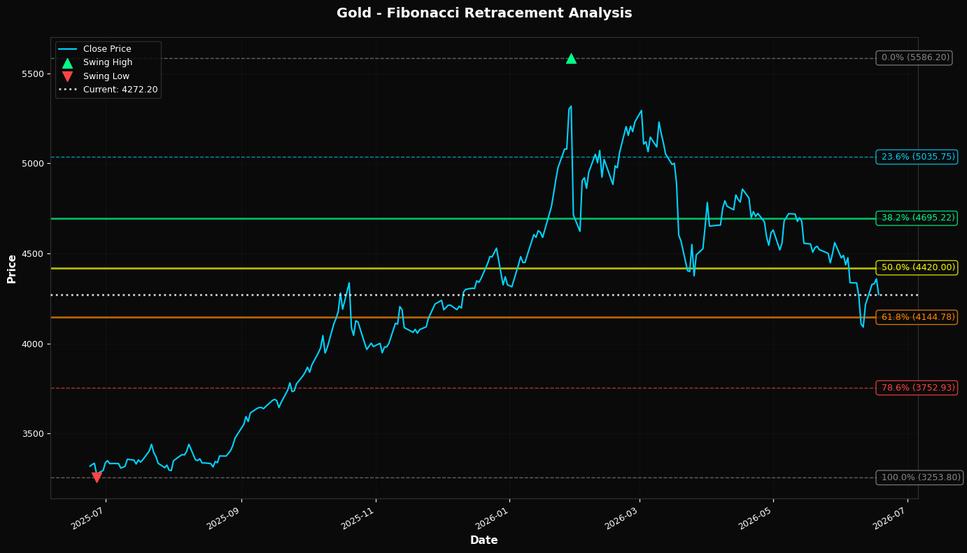
🎯 Key Trading Levels
Key Fibonacci Levels:
- 38.2%: $4695.22
- 50.0%: $4420.00
- 61.8%: $4144.78
Support: $3253.80 (Swing Low), $4559.27 (50-Day MA)
Resistance: $5586.20 (Swing High)
Disclaimer
The content on MarketsFN.com is provided for educational and informational purposes only. It does not constitute financial advice, investment recommendations, or trading guidance. All investments involve risks, and past performance does not guarantee future results. You are solely responsible for your investment decisions and should conduct independent research and consult a qualified financial advisor before acting. MarketsFN.com and its authors are not liable for any losses or damages arising from your use of this information.