Gold: Down 3.6% to $3982.40 — Oversold at RSI 29 — Watching for Bounce
· Commodities · QuoteReporter
Gold: Down 3.6% to $3982.40 — Oversold at RSI 29 — Watching for Bounce
Analysis Date: June 24, 2026
📊 Current Market Data
CURRENT PRICE
$3982.40
DAILY CHANGE
-3.57%
WEEKLY CHANGE
-8.05%
52W HIGH
$5586.20
52W LOW
$3253.80
💡 Key Market Factors
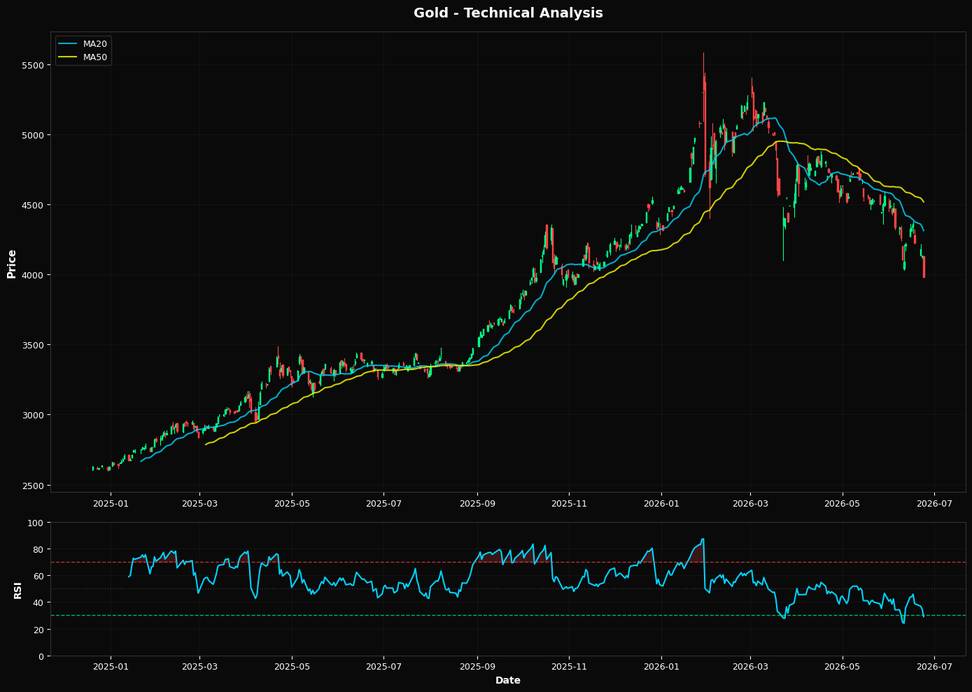
Gold is currently facing a significant downward pressure, with its price at $3982.40, marking a daily decline of 3.57% and a weekly drop of 8.05%. The most critical macro driver impacting gold today is the strength of the U.S. dollar, which has been bolstered by the Federal Reserve's hawkish stance on interest rates. As the Fed continues to signal potential rate hikes to combat persistent inflation, the dollar has appreciated, making gold less attractive as a non-yielding asset. This dynamic is crucial because it directly affects gold's appeal as a safe haven, especially when real yields are rising, diminishing gold's allure relative to interest-bearing securities. From a technical perspective, gold's Relative Strength Index (RSI) is at 29.1, indicating that it is in oversold territory. This suggests a potential for a short-term rebound, although the broader trend remains bearish. The current price is significantly below its 20-day moving average of $4313.33, the 50-day moving average of $4518.26, and the 200-day moving average of $4444.03, reinforcing the bearish outlook. The nearest Fibonacci support level at 61.8% is at $4144.78, which gold has already breached, suggesting further downside risk. The alignment of these technical indicators points to a continued bearish bias unless a significant reversal catalyst emerges. A key risk that could alter the current bearish trajectory for gold is a sudden shift in Federal Reserve policy. If upcoming economic data, such as the next Consumer Price Index (CPI) release, shows a significant cooling in inflation, it could prompt the Fed to pause or even reverse its rate hike plans. Such a development would likely weaken the dollar and lower real yields, providing a supportive environment for gold prices to recover. This potential pivot is a critical factor that the market may be underpricing, given the current focus on the Fed's hawkish rhetoric. Looking ahead, the next CPI report will be pivotal in shaping gold's direction. A lower-than-expected inflation reading could validate a bullish reversal, as it would likely lead to a reassessment of the Fed's rate trajectory and the dollar's strength. Conversely, if inflation remains stubbornly high, reinforcing the Fed's current policy path, gold could face further declines. Investors should closely monitor this data point, as it will provide crucial insights into the future path of monetary policy and its implications for gold.📈 Technical Indicators Summary
RSI (14)
29.1
50-Day MA
$4518.26
200-Day MA
$4444.03
Fib Level
61.8%
📊 Technical Analysis Chart (18-Month View)
📐 Fibonacci Retracement Analysis
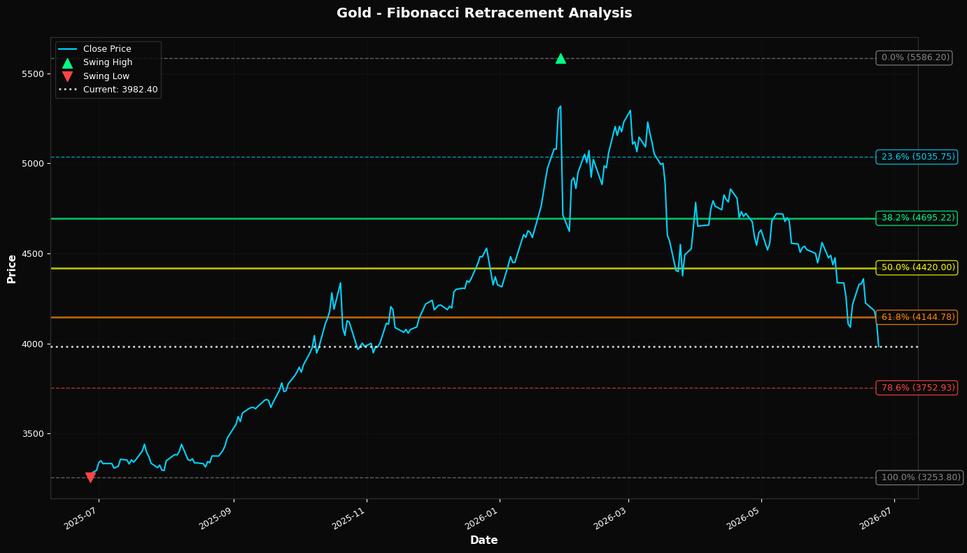
🎯 Key Trading Levels
Key Fibonacci Levels:
- 38.2%: $4695.22
- 50.0%: $4420.00
- 61.8%: $4144.78
Support: $3253.80 (Swing Low), $4518.26 (50-Day MA)
Resistance: $5586.20 (Swing High)
Disclaimer
The content on MarketsFN.com is provided for educational and informational purposes only. It does not constitute financial advice, investment recommendations, or trading guidance. All investments involve risks, and past performance does not guarantee future results. You are solely responsible for your investment decisions and should conduct independent research and consult a qualified financial advisor before acting. MarketsFN.com and its authors are not liable for any losses or damages arising from your use of this information.