Gold Gains 1.3%
· Commodities · MarketsFN Team
Gold Gains 1.3%
Analysis Date: February 27, 2026
📊 Current Market Data
CURRENT PRICE
$5244.10
DAILY CHANGE
+1.31%
WEEKLY CHANGE
+3.65%
52W HIGH
$5586.20
52W LOW
$2834.10
💡 Key Market Factors
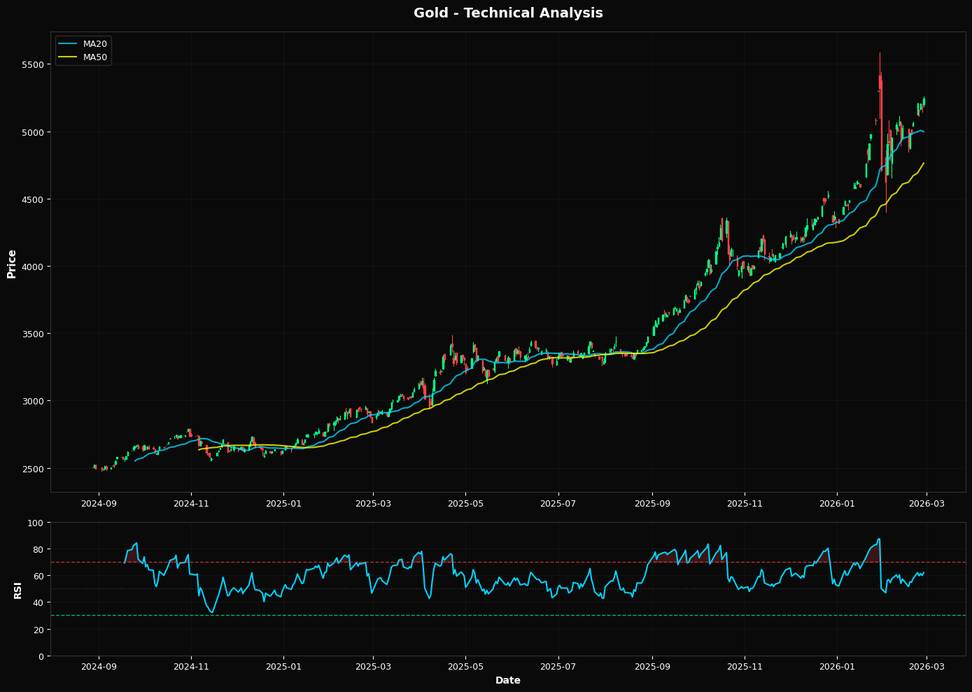
Gold prices have surged to $5244.10, reflecting a daily increase of 1.31% and a weekly gain of 3.65%. This upward momentum is largely driven by heightened inflation expectations, as recent economic data suggests persistent inflationary pressures. Investors are seeking gold as a hedge against inflation, pushing prices higher as they anticipate continued erosion of fiat currency value. Interest rates remain a critical factor, with the Federal Reserve maintaining a cautious stance on future rate hikes. While the Fed has signaled a potential pause, the market remains sensitive to any shifts in monetary policy, which could impact gold's attractiveness as a non-yielding asset. Current market sentiment suggests that any dovish tilt could further support gold prices. From a technical perspective, gold is trading well above its 20-day and 50-day moving averages, indicating strong bullish momentum. The RSI at 62.1 suggests that the market is approaching overbought conditions, but not yet at extreme levels. Key resistance is likely around the psychological level of $5300, while support is seen near the 20-day moving average at $4996.86, providing a potential floor for any short-term retracements.📈 Technical Indicators Summary
RSI (14)
62.1
50-Day MA
$4763.03
200-Day MA
$3932.79
Fib Level
38.2%
📊 Technical Analysis Chart (18-Month View)
📐 Fibonacci Retracement Analysis
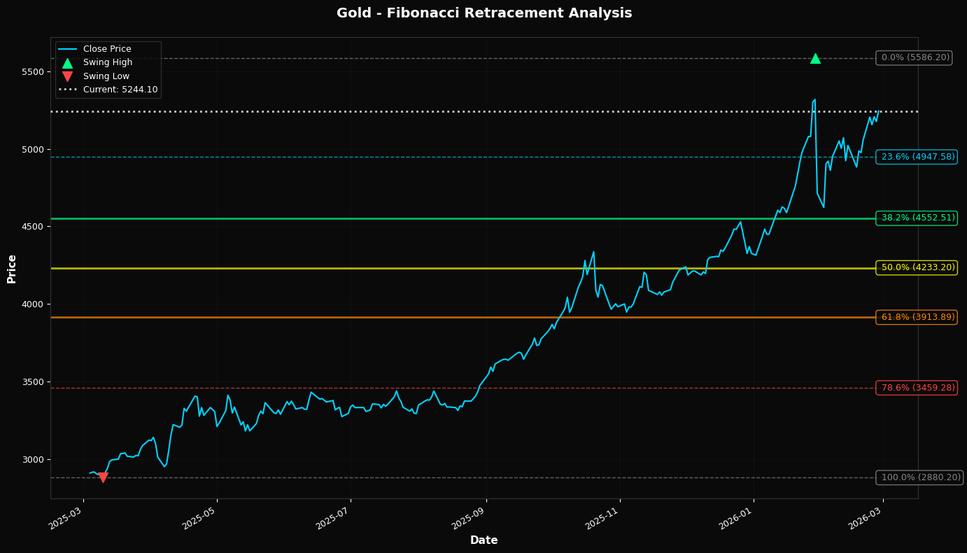
🎯 Key Trading Levels
Key Fibonacci Levels:
- 38.2% Level: $4552.51
- 50.0% Level: $4233.20
- 61.8% Level: $3913.89
Support: $2880.20 (Swing Low), $4763.03 (50-day MA)
Resistance: $5586.20 (Swing High)
Disclaimer
The content on MarketsFN.com is provided for educational and informational purposes only. It does not constitute financial advice, investment recommendations, or trading guidance. All investments involve risks, and past performance does not guarantee future results. You are solely responsible for your investment decisions and should conduct independent research and consult a qualified financial advisor before acting. MarketsFN.com and its authors are not liable for any losses or damages arising from your use of this information.