Gold Rallies 3.8%
· Commodities · MarketsFN Team
Gold Rallies 3.8%
Analysis Date: April 08, 2026
📊 Current Market Data
CURRENT PRICE
$4832.00
DAILY CHANGE
+3.76%
WEEKLY CHANGE
+3.97%
52W HIGH
$5586.20
52W LOW
$2965.80
💡 Key Market Factors
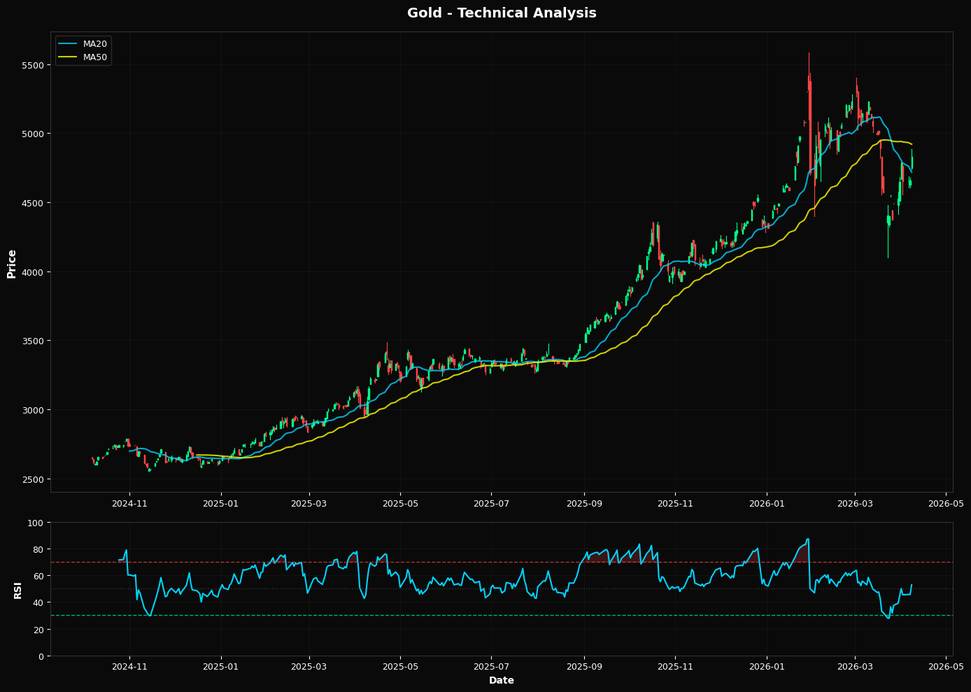
Gold prices have experienced a notable increase, currently trading at $4832.00, with a daily change of +3.76% and a weekly change of +3.97%. This upward momentum is partly influenced by persistent inflationary pressures, as recent data indicates inflation expectations remain elevated. Investors often turn to gold as a hedge against inflation, bolstering demand and supporting price gains. Interest rates remain a critical factor, with the Federal Reserve's recent signals suggesting a more cautious approach to further rate hikes. This dovish stance has eased upward pressure on real yields, making non-yielding assets like gold more attractive. As a result, the metal's appeal is enhanced in a low-interest-rate environment, contributing to its recent price strength. From a technical perspective, gold's RSI at 52.9 suggests a neutral stance, indicating neither overbought nor oversold conditions. The price is currently above the 20-day moving average of $4718.33, suggesting short-term bullish momentum, but remains below the 50-day moving average of $4920.89, indicating potential resistance. The Fibonacci level at 38.2% ($4625.81) serves as a key support, which has held firm, reinforcing the current bullish sentiment.📈 Technical Indicators Summary
RSI (14)
52.9
50-Day MA
$4920.89
200-Day MA
$4136.18
Fib Level
38.2%
📊 Technical Analysis Chart (18-Month View)
📐 Fibonacci Retracement Analysis
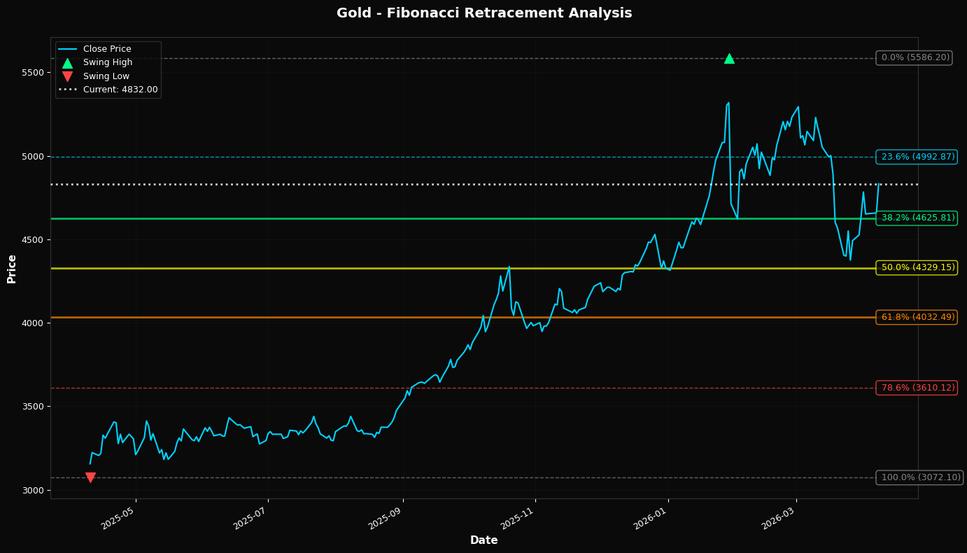
🎯 Key Trading Levels
Key Fibonacci Levels:
- 38.2% Level: $4625.81
- 50.0% Level: $4329.15
- 61.8% Level: $4032.49
Support: $3072.10 (Swing Low), $4920.89 (50-day MA)
Resistance: $5586.20 (Swing High)
Disclaimer
The content on MarketsFN.com is provided for educational and informational purposes only. It does not constitute financial advice, investment recommendations, or trading guidance. All investments involve risks, and past performance does not guarantee future results. You are solely responsible for your investment decisions and should conduct independent research and consult a qualified financial advisor before acting. MarketsFN.com and its authors are not liable for any losses or damages arising from your use of this information.