Gold Retraces 1.0%
· Commodities · QuoteReporter
Gold Retraces 1.0%
Analysis Date: May 19, 2026
📊 Current Market Data
CURRENT PRICE
$4504.80
DAILY CHANGE
-1.05%
WEEKLY CHANGE
-3.69%
52W HIGH
$5586.20
52W LOW
$3207.50
💡 Key Market Factors
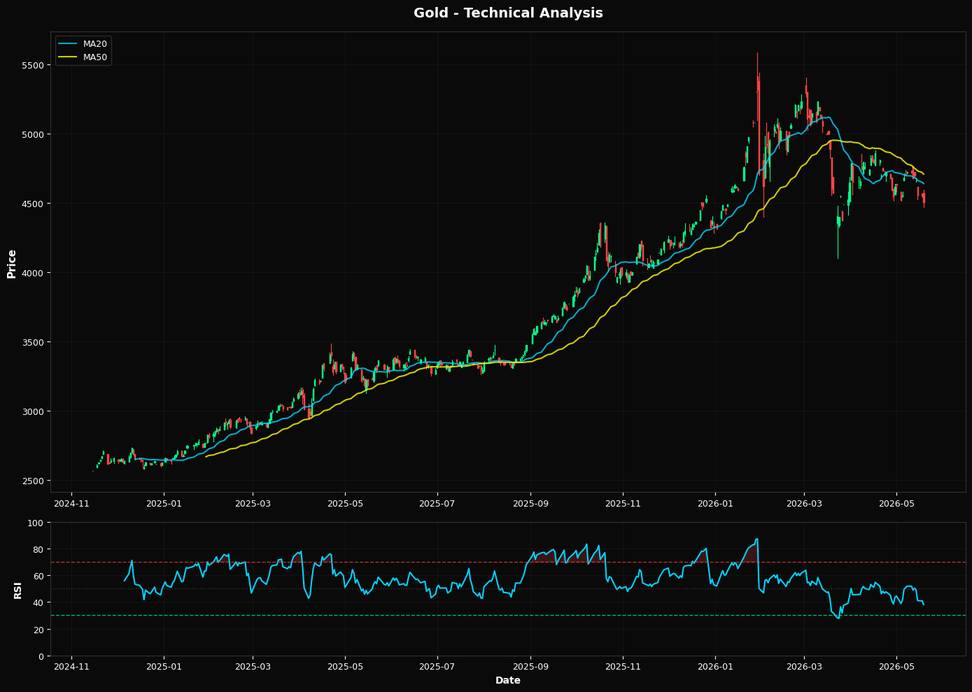
Gold prices have recently experienced a decline, with the current price at $4504.80, reflecting a daily decrease of 1.05% and a weekly drop of 3.69%. This downward trend is occurring amidst a backdrop of persistent inflationary pressures, which typically support gold as a hedge. However, the market's focus has shifted towards the Federal Reserve's monetary policy, which remains hawkish. The Fed's commitment to maintaining higher interest rates to combat inflation is exerting downward pressure on gold, as higher rates increase the opportunity cost of holding non-yielding assets like gold. From a technical perspective, gold is currently trading below its 20-day and 50-day moving averages, which are $4638.96 and $4707.25, respectively. This suggests a bearish trend in the short to medium term. The Relative Strength Index (RSI) stands at 38.1, indicating that gold is approaching oversold territory but has not yet reached it. The nearest significant Fibonacci retracement level is the 50.0% mark at $4414.30, which could act as a potential support level if the current downtrend continues. Geopolitical factors, while generally influential on gold prices, do not currently present any major disruptions that would significantly alter the market dynamics. The ongoing global economic uncertainties, however, continue to play a role in investor sentiment. In summary, gold's price movement is primarily influenced by the Fed's rate policy and technical indicators, with inflation concerns providing a complex backdrop that could shift market sentiment if inflationary pressures intensify or the Fed signals a change in its policy stance.📈 Technical Indicators Summary
RSI (14)
38.1
50-Day MA
$4707.25
200-Day MA
$4331.23
Fib Level
50.0%
📊 Technical Analysis Chart (18-Month View)
📐 Fibonacci Retracement Analysis
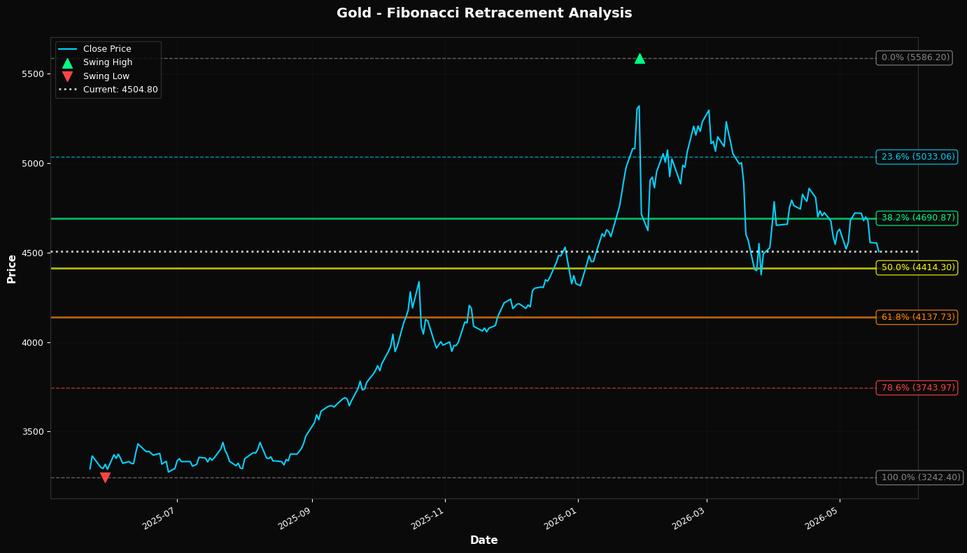
🎯 Key Trading Levels
Key Fibonacci Levels:
- 38.2%: $4690.87
- 50.0%: $4414.30
- 61.8%: $4137.73
Support: $3242.40 (Swing Low), $4707.25 (50-Day MA)
Resistance: $5586.20 (Swing High)
Disclaimer
The content on MarketsFN.com is provided for educational and informational purposes only. It does not constitute financial advice, investment recommendations, or trading guidance. All investments involve risks, and past performance does not guarantee future results. You are solely responsible for your investment decisions and should conduct independent research and consult a qualified financial advisor before acting. MarketsFN.com and its authors are not liable for any losses or damages arising from your use of this information.