Gold Sells Off 2.9%
· Commodities · QuoteReporter
Gold Sells Off 2.9%
Analysis Date: May 15, 2026
📊 Current Market Data
CURRENT PRICE
$4544.20
DAILY CHANGE
-2.86%
WEEKLY CHANGE
-3.73%
52W HIGH
$5586.20
52W LOW
$3173.90
💡 Key Market Factors
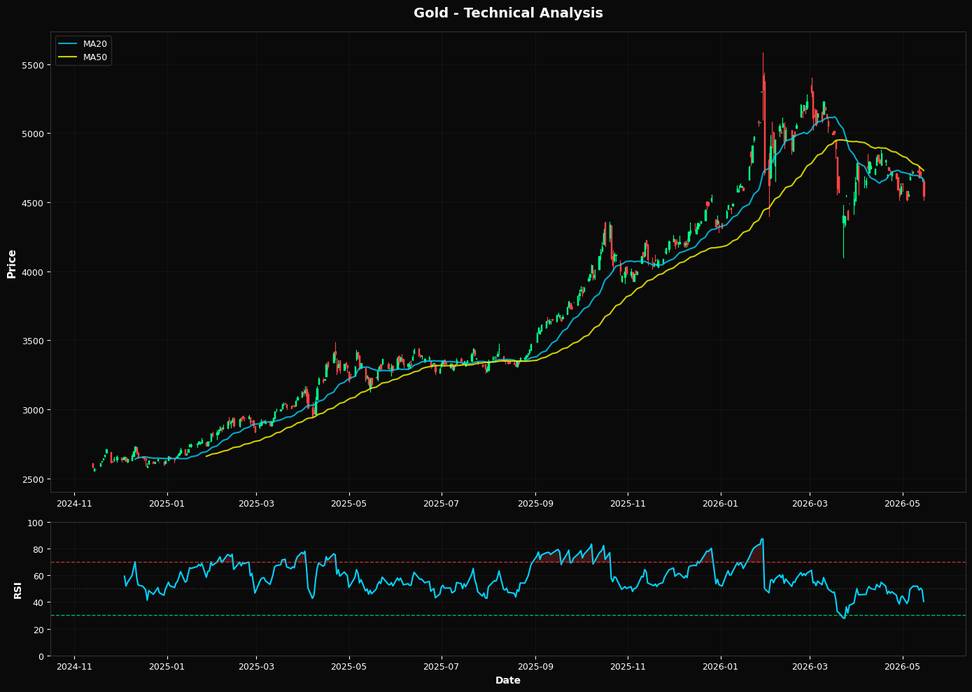
Gold's current price dynamics reflect a significant downward pressure, with a daily decline of 2.86% and a weekly drop of 3.73%. This bearish sentiment is underscored by the Relative Strength Index (RSI) standing at 40.4, indicating that gold is approaching oversold territory but not quite there yet. The price is also trading below its 20-day and 50-day moving averages, which are at $4660.77 and $4730.62, respectively, suggesting a continuation of the bearish trend unless a reversal occurs. The Federal Reserve's monetary policy remains a critical factor influencing gold prices. Recent indications from the Fed suggest a potential for maintaining higher interest rates for an extended period to combat persistent inflationary pressures. This hawkish stance typically strengthens the U.S. dollar and increases bond yields, both of which exert downward pressure on non-yielding assets like gold. From a technical perspective, gold's proximity to the nearest Fibonacci retracement level at 38.2% ($4677.54) is noteworthy. This level could act as a potential resistance point if prices attempt to recover. However, the current trading below this level reinforces the bearish outlook, and failure to reclaim this level could lead to further declines. Geopolitical tensions, while always a potential catalyst for gold price movements, have not presented any major developments recently that would significantly impact gold's safe-haven appeal. As such, the primary focus remains on macroeconomic indicators and monetary policy, which are currently driving the market sentiment against gold.📈 Technical Indicators Summary
RSI (14)
40.4
50-Day MA
$4730.62
200-Day MA
$4319.09
Fib Level
38.2%
📊 Technical Analysis Chart (18-Month View)
📐 Fibonacci Retracement Analysis
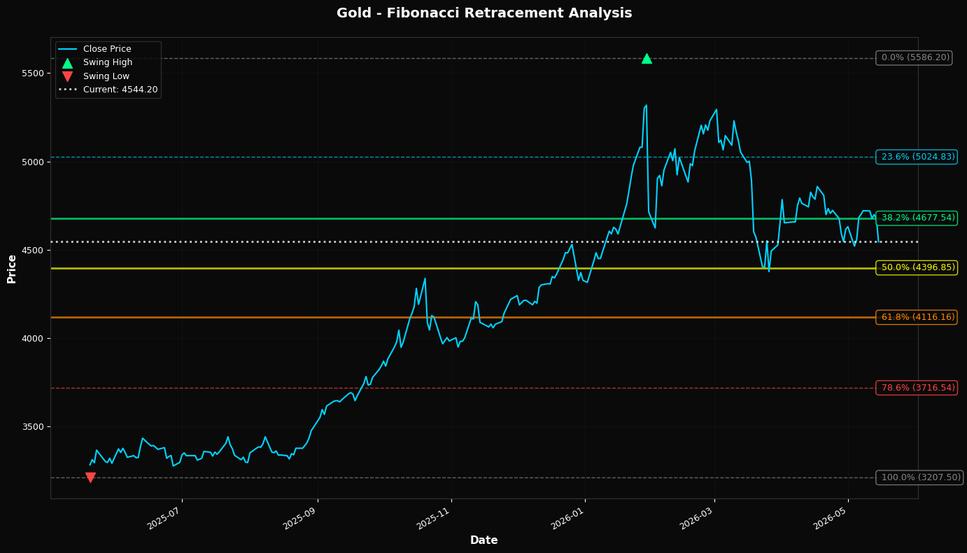
🎯 Key Trading Levels
Key Fibonacci Levels:
- 38.2%: $4677.54
- 50.0%: $4396.85
- 61.8%: $4116.16
Support: $3207.50 (Swing Low), $4730.62 (50-Day MA)
Resistance: $5586.20 (Swing High)
Disclaimer
The content on MarketsFN.com is provided for educational and informational purposes only. It does not constitute financial advice, investment recommendations, or trading guidance. All investments involve risks, and past performance does not guarantee future results. You are solely responsible for your investment decisions and should conduct independent research and consult a qualified financial advisor before acting. MarketsFN.com and its authors are not liable for any losses or damages arising from your use of this information.